
Page 37 - scheppingen
P. 37
NOVEL HISTOPATHOLOGICAL PATTERNS IN CORTICAL TUBERS IN TSC
28 tuber samples and 7 perituberal cortex specimens. Subgroup analysis revealed no correlation of mTORC1 activation, neuronal density or gliosis with the localization of the tuber. However, the amount of GFAP positivity was negatively correlated with the age at surgery (Kendall-tau, R= -0.271, p= 0.025).
To broaden our knowledge of these novel patterns we subsequently introduced an age- and region-matched control group to see whether the subgroups differ from autopsy controls.
Inflammation and small vessel density
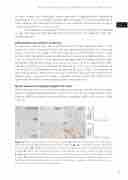
An increase in inflammatory cells in cortical tubers has been previously shown 13. The amount of T-cells (CD3 positive cells/mm2) was significantly affected by the tuber type (H[4]= 16.730, p= 0.002; Table 1). We confirmed a gain of inflammatory markers in type B and C tubers compared to postmortem control in a pairwise comparison (B: p= 0.047; C: p= 0.012; Fig. 3A, B, C). A similar pattern was be observed in microglial activation (per- centage of Cr3/43 positivity; H[4]= 16.417, p= 0.003; Table 1; Fig. 3E-G). Type B and C tubers showed a significant gain in microglial activation (B: p= 0.016; C: p= 0.005) compared to control (Fig. 3H). No differences could be detected for type A tubers. Furthermore, we were able to detect a difference in small vessel density (CD34 staining) among the cat- egories (H[4]= 12.835, p=0.012; Table 1). However, pairwise comparison failed to reach significance when directly compared to autopsy brain specimens.
Myelin content and oligodendroglial cell count
Within the tuber patterns we were able to observe myelin loss whereas there was no dif- ference in oligodendroglial cell count (Fig. 4A, B, D, E). The overall myelin content (OMC, based on MBP) was altered among the different categories (H[4]= 11.691, p=0.020; Table 1; Fig. 4C).
Figure 3 Inflammatory markers and vessel structure. A. Representative amount of T-cells lying in the white matter (WM) of control samples (CD3 staining). B. + C. T-cell content within type B and C tubers (CD3). D. Significant increase of CD3 positive cells in type B and C tubers compared to controls. E. Almost no microglial activation can be detected in autopsy cortex (Cr3/43 staining). F. + G. Representative WM of type B and C tubers showing an increase in microglial activation (Cr3/43). H. Quantification of the Cr3/43 positive content revealed a significant difference be- tween controls and type B as well as C tubers. Scale bar in g = 100μm and applies also to a, b, c, e, f and g. CO = control; PT = perituberal cortex.
35
two
