
Page 35 - scheppingen
P. 35
NOVEL HISTOPATHOLOGICAL PATTERNS IN CORTICAL TUBERS IN TSC
conducted on 1000 samples with bias-corrected and accelerated confidence intervals. P-values were considered significant if < 0.05.
Results
Patterns of cortical tubers
In order to find differences in histological appearance the three most accessible fea- tures of a cortical tuber (mTORC1 activation, dysmorphic neurons and giant cells) were admitted to a hierarchical cluster analysis. As a result, the tubers were divided into three different clusters (S2 Fig). To determine the main histological discriminants between the clusters a one-way ANOVA was performed. There were significant differences in the numbers of dysmorphic neurons (p=0.000) and giant cells (p=0.001) whereas pS6- Ser235/236 positivity failed to reach significance. Tubers were then independently ana- lyzed by two neuropathologists experienced in evaluating epilepsy surgery specimens (Angelika Mühlebner and Eleonora Aronica) and the microscopic assessment of the clusters revealed three different patterns. These were translated into the following qual- itative criteria:
A: low density of giant cells ≤ 10/mm2 or dysmorphic neurons ≤ 3/mm2 (Fig. 1B) B: high density of giant cells > 10/mm2 or dysmorphic neurons > 3/mm2 (Fig. 1C) C: giant cells, dysmorphic neurons and calcifications (Fig. 1D)
We submitted a randomly selected subset of cases to an online platform in order to validate our findings among other trained neuropathologists (six participants).
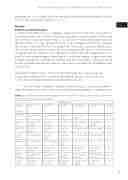
Table 1 Quantification. All available quantification data of the image analysis study. Significance levels are presented in the last column.
Classification
median (range)
type A
type B
type C
Perituberal
control
p-value
pS6 (%)
1.73 (0.84-4.09)
1.53(0.63-6.64)
4.14(0.88- 6.82)
0.70(0.44- 3.64)
0.18 (0.03-0.67)
0.000
neurons/ mm2
261.20(106.56- 296.26)
139.18(32.03- 258.29)
175.88(55.70- 277.31)
256.63(126.69- 459.07)
351.39(275.69- 540.46)
0.015
GFAP (%)
16.87(1.01- 44.41)
18.34(8.16- 34.06)
13.87(7.09- 34.02)
5.89(2.15-12.78)
5.61(2.25-9.34)
0.019
T-cells/ mm2
7.70(4.23-19.32)
13.81(7.38- 35.85)
22.64(7.29- 34.20)
9.08(1.91-13.55)
5.54(0.56-29.76)
0.002
Cr3/43 (%)
3.10(0.21-7.63)
2.16(0.25-33.24)
5.14(0.26- 11.66)
.95(0.11-2.50)
.51(0.07-1.70)
0.003
vessels/ mm2
73.85(36.65- 169.35)
73.90(40.06- 190.45)
114.48(77.57- 154.12)
66.93(28.49- 114.06)
130.41(36.77- 239.79)
0.012
OMC (%lum)
389.95(161.97- 3185.74)
196.23(0.24- 8110.52)
273.460.01- 3168.69)
2711.58(909.27- 6869.83)
2801.68(188.05- 5815.44)
0.020
oligos/ mm2
159.22(9.51- 405.16)
103.03(20.51- 390.42)
133.31(66.73- 832.46)
184.98(109.86- 334.99)
208.17(88.01- 522.37)
>0.05
33
two
