
Page 94 - Secondary school students’ university readiness and their transition to university Els van Rooij
P. 94
Systematic review of rst-year success
3
93
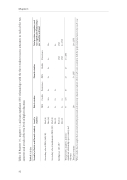
Table II.2 Demographic factors
Variable (n Dutch and Flemish studies)
Level (n studies)
Dutch studies
Flemish studies
Total positive, negative, and non-signi cant relationships per variable and level
Gender: female (11D; 6F)*
Prof (6) Uni (12)
GPA 3NS
Credits 4+
2+; 5NS
Persistence 2+
NS
GPA 1+; 1NS
Credits 1+
1+; 1NS
Persistence 2+
2+; 2NS
9+
6+; 13NS
Age (4D)
Prof (1) Uni (3)
1NS 1NS; 2-
1NS 2NS; 3-
SES (2D; 2F)
Prof (0) Uni (4)
1NS; 1- 2NS
Nationality: majority (3D)
Prof (0) Uni (3)
Total positive, negative, and non- signi cant relationships per country and outcome
1+; 1NS 1+; 7NS; 1-
2+; 1NS 9+; 8NS; 2-
2+; 1NS
2+; 1NS
Total per country
12+; 16NS; 3-
10+; 5NS
22+; 21NS; 3-
1+
1+
1+
3+; 1NS
1+; 1NS 5+; 3NS
4+; 3NS 3+; 2NS
*When studies had a sample that consisted of both professional and university education students, their results were counted in both the professional and university results row.
