
Page 93 - Secondary school students’ university readiness and their transition to university Els van Rooij
P. 93
Chapter 3
92
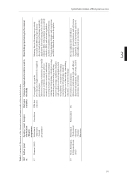
Tables II Positive (+), negative (-), and non-signi cant (NS) relationships with the three student success outcomes in each of the two countries and at each of the two levels of higher education
Table II.1 Ability
Variable (n Dutch and Flemish studies)
Level (n studies)
Dutch studies
Flemish studies
Total positive, negative, and non-signi cant relationships per variable and level
Secondary school GPA (14D; 2F)
Prof (0) Uni (16)
Secondary school mathematics GPA (2D)
Prof (0) Uni (2)
Intelligence (1D; 1F)*
Prof (1) Uni (2)
1NS 1NS 1NS 2+; 1NS
Total positive, negative, and non- signi cant relationships per country and outcome
1+ 1+
7+ 13+ 4+
2+
2+
1+; 2NS
Total per country
24+
5+; 2NS
29+; 2NS
GPA Credits
5+ 10+ 3+
GPA 2+
Credits Persistence
2+ 1+ 23+
1+ 2+ 1+
4+
Persistence
*When studies had a sample that consisted of both professional and university education students, their results were counted in both the professional and university results row.
