
Page 42 - Migraine, the heart and the brain
P. 42
Chapter 2
40
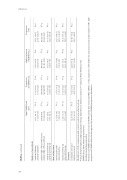
eTable 2. continued Number of aura attacks
High DWMH load at FU
Progression of DWMH load
High progression of DWMH load
Progression of IH
<median (lifetime) ≥median (lifetime)
1.1 [0.3-4.0] 0.9 [0.3-3.3]
P=.8 P*=.2 P=.7
1.7 [0.7-4.1] P=.8 1.7 [0.7-4.3]
1.6 [0.4-6.2] P=.8 1.3 [0.3-5.0]
5.7 [0.6-57.1] P=.8 4.6 [0.5-45.9]
median (IQR) of those with lesions median (IQR) of those without
158 (73-411) 150 (49-262)
158 (68-283) P*=.5 149 (43-281)
158 (73-411) P*=.2 150 (49-262)
113 (26-265) P*=.5 154 (65-292)
<median at follow-up ≥median at follow-up
1.1 [0.2-5.3] 1.1 [0.3-4.6]
1.5 [0.5-4.2] P=.9 2.2 [0.7-6.7]
1.6 [0.3-8.7] P=.7 1.5 [0.3-6.8]
6.0 [0.5-77.7] P=.6 3.2 [0.2-48.1]
Aura activity status
inactive at baseline active at baseline
2.0 [0.5-7.8] 0.8 [0.2-2.5]
P=.2 P=.06
2.0 [0.6-6.2] P=.8 1.6 [0.7-3.5]
2.7 [0.6-11.8] P=.2 1.1 [0.3-3.8]
5.9 [0.5-68.5] P=.9 5.4 [0.6-48.2]
inactive at follow-up active at follow-up
0.3 [0.1-2.0] 1.7 [0.6-4.8]
1.5 [0.5-4.3] P=.4 2.3 [1.0-5.0]
0.5 [0.1-3.0] P=.05 2.6 [0.8-8.3]
6.8 [0.6-71.4] P=.8 7.8 [0.9-64.3]
Treatment
no triptans ever used triptans ever used
1.4 [0.6-3.7] 1.5 [0.4-6.0]
P=.8
1.8 [0.9-3.7] P=.2 4.3 [1.1-16.6]
2.2 [0.8-6.3] P=.5 2.9 [0.7-11.8]
8.9 [1.1-69.3] P=.2 2.5 [0.1-42.5]
OR with [95% CI] for comparison with controls; controls as a reference group
P-values between migraine subgroups adjusted for age, hypertension, diabetes, education; P*-values by Mann Whitney U test
DWMH=Deep white matter hyperintensities
IH=Infratentorial hyperintensities
Progression of DWMH de ned as an increase in DWMH volume after 9 years (Δ CAM2-CAM1≥0.01 ml); progression of IHs de ned as an increase in size and/or number of IHs; high progression of DWMH de ned as the upper 20th percentile of DWMH progression distribution
