
Page 63 - Effects of radiotherapy and hyperbaric oxygen therapy on oral microcirculation Renee Helmers
P. 63
HBOT and vascular regeneration in oral mucosal flaps
Day 7 Day 9
3.21 ± 0.12 3.20 ± 0.12 3.22 ± 0.19 3.24 ± 0.21
Day 11 Day 14 Day 21
3.23 ± 0.12 3.30 ± 0.13 3.40 ± 0.14* 3.27 ± 0.21 3.33 ± 0.20 3.49 ± 0.25*
7.5 ± 0.2 7.5 ± 0.3 7.6 ± 0.2 7.7 ± 0.1 7.8 ± 0.2 7.6 ± 0.2 7.6 ± 0.2 7.6 ± 0.2 7.5 ± 0.1 7.6 ± 0.2
5.46 ± 0.20 5.50 ± 0.12 5.58 ± 0.07 5.64 ± 0.11 5.72 ± 0.15
5.49 ± 0.22 5.43 ± 0.26 5.43 ± 0.25 5.44 ± 0.19 5.41 ± 0.18 3
5.90 ± 0.78 5.16 ± 0.75 6.40 ± 0.82 6.08 ± 0.85 6.11 ± 0.70 7.04 ± 1.26 6.86 ± 1.06 6.91 ± 0.82 6.95 ± 0.82 7.45 ± 1.62
289 ± 64 269 ± 78 224 ± 38 222 ± 36 260 ± 61 304 ± 48 308 ± 33 284 ± 13 292 ± 57 259 ± 30
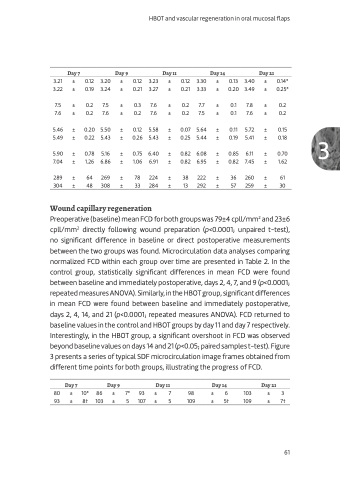
Wound capillary regeneration
Preoperative (baseline) mean FCD for both groups was 79±4 cpll/mm2 and 23±6 cpll/mm2 directly following wound preparation (p<0.0001; unpaired t-test), no significant difference in baseline or direct postoperative measurements between the two groups was found. Microcirculation data analyses comparing normalized FCD within each group over time are presented in Table 2. In the control group, statistically significant differences in mean FCD were found between baseline and immediately postoperative, days 2, 4, 7, and 9 (p<0.0001; repeated measures ANOVA). Similarly, in the HBOT group, significant differences in mean FCD were found between baseline and immediately postoperative, days 2, 4, 14, and 21 (p<0.0001; repeated measures ANOVA). FCD returned to baseline values in the control and HBOT groups by day 11 and day 7 respectively. Interestingly, in the HBOT group, a significant overshoot in FCD was observed beyond baseline values on days 14 and 21 (p<0.05; paired samples t-test). Figure 3 presents a series of typical SDF microcirculation image frames obtained from different time points for both groups, illustrating the progress of FCD.
Day 7 Day 9 Day 11
80 ± 10* 86 ± 7* 93 ± 7 93 ± 8† 103 ± 5 107 ± 5
Day 14
98 ± 6 109 ± 5†
Day 21
103 ± 3 109 ± 7†
61
