
Page 64 - Effects of radiotherapy and hyperbaric oxygen therapy on oral microcirculation Renee Helmers
P. 64
Chapter 3
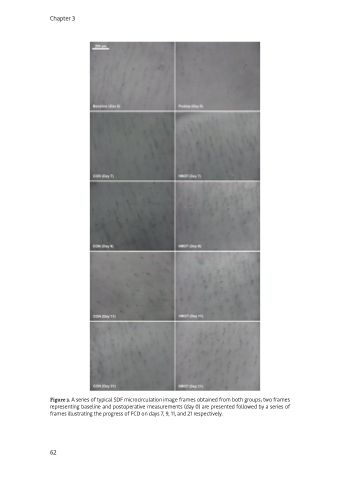
Figure 3. A series of typical SDF microcirculation image frames obtained from both groups; two frames representing baseline and postoperative measurements (day 0) are presented followed by a series of frames illustrating the progress of FCD on days 7, 9, 11, and 21 respectively.
62
