
Page 62 - Effects of radiotherapy and hyperbaric oxygen therapy on oral microcirculation Renee Helmers
P. 62
Chapter 3
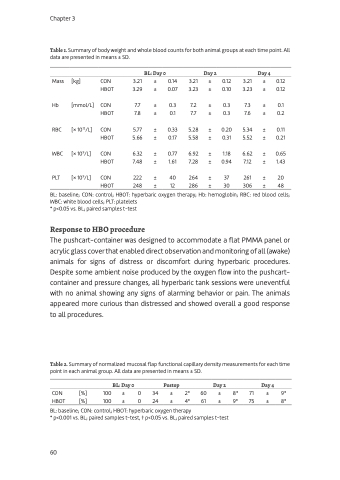
Table 1. Summary of body weight and whole blood counts for both animal groups at each time point. All data are presented in means ± SD.
Mass [kg]
Hb [mmol/L] RBC [× 1012/L] WBC [× 109/L] PLT [× 109/L]
CON 3.21
BL: Day 0
± 0.14 3.21 ± 0.07 3.23
± 0.3 7.2 ± 0.1 7.7
± 0.33 5.28 ± 0.17 5.58
± 0.77 6.92 ± 1.61 7.28
± 40 264 ± 12 286
Day 2
± ±
± ±
± ±
± ±
± ±
0.12 3.21 0.10 3.23
0.3 7.3 0.3 7.6
0.20 5.34 0.31 5.52
1.18 6.62 0.94 7.12
37 261 30 306
Day 4
± 0.12 ± 0.12
± 0.1 ± 0.2
± 0.11 ± 0.21
± 0.65 ± 1.43
± 20 ± 48
BL: baseline; CON: control;
WBC: white blood cells; PLT: platelets * p<0.05 vs. BL; paired samples t-test
Response to HBO procedure
oxygen therapy; Hb:
hemoglobin; RBC: red blood cells;
HBOT
CON HBOT
CON HBOT
CON HBOT
CON HBOT
3.29
7.7 7.8
5.77 5.66
6.32 7.48
222 248
HBOT: hyperbaric
The pushcart-container was designed to accommodate a flat PMMA panel or acrylic glass cover that enabled direct observation and monitoring of all (awake) animals for signs of distress or discomfort during hyperbaric procedures. Despite some ambient noise produced by the oxygen flow into the pushcart- container and pressure changes, all hyperbaric tank sessions were uneventful with no animal showing any signs of alarming behavior or pain. The animals appeared more curious than distressed and showed overall a good response to all procedures.
Table 2. Summary of normalized mucosal flap functional capillary density measurements for each time point in each animal group. All data are presented in means ± SD.
BL: Day 0 Postop Day 2 Day 4
CON [%] 100 ± 0 34 ± 2* 60 ± 8* 71 ± 9* HBOT [%] 100 ± 0 24 ± 4* 61 ± 9* 75 ± 8*
BL: baseline; CON: control; HBOT: hyperbaric oxygen therapy
* p<0.001 vs. BL; paired samples t-test, † p<0.05 vs. BL; paired samples t-test
60
