
Page 40 - Effects of radiotherapy and hyperbaric oxygen therapy on oral microcirculation Renee Helmers
P. 40
Chapter 2
38
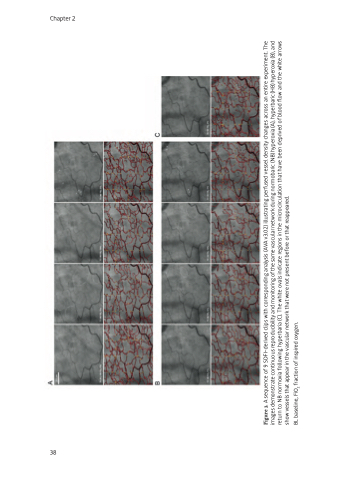
Figure 3. A sequence of 9 SDFI-derived clips with corresponding analysis (AVA v3.02) illustrating perfused vessel density changes across an entire experiment. The images demonstrate continuous reproducibility and monitoring of the same vascular network during normobaric (NB) hyperoxia (A), hyperbaric (HB) hyperoxia (B), and return to NB normoxia following hyperbaria (C). The white ovals indicate regions in the microcirculation that have been deprived of blood flow and the white arrows show vessels that appear in the vascular network that were not present before or that reappeared.
BL baseline, FiO2 fraction of inspired oxygen.
