
Page 68 - Bladder Dysfunction in the Context of the Bladder-Brain Connection - Ilse Groenendijk.pdf
P. 68
66
Chapter 3
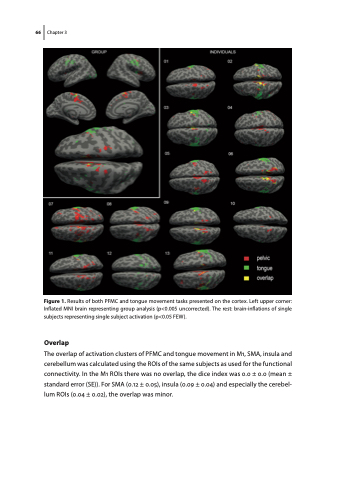
Figure 1. Results of both PFMC and tongue movement tasks presented on the cortex. Left upper corner: Inflated MNI brain representing group analysis (p<0.005 uncorrected). The rest: brain-inflations of single subjects representing single subject activation (p<0.05 FEW).
Overlap
The overlap of activation clusters of PFMC and tongue movement in M1, SMA, insula and cerebellum was calculated using the ROIs of the same subjects as used for the functional connectivity. In the M1 ROIs there was no overlap, the dice index was 0.0 ± 0.0 (mean ± standard error (SE)). For SMA (0.12 ± 0.05), insula (0.09 ± 0.04) and especially the cerebel- lum ROIs (0.04 ± 0.02), the overlap was minor.
