
Page 38 - Bladder Dysfunction in the Context of the Bladder-Brain Connection - Ilse Groenendijk.pdf
P. 38
36
Chapter 2
L
Coronal y = 3
Coronal R y = -20
1
2
3 78
9
5
Coronal y = -50
Axial z = 21
Axial z = 65
Sagittal x = 3
1
1 2
4
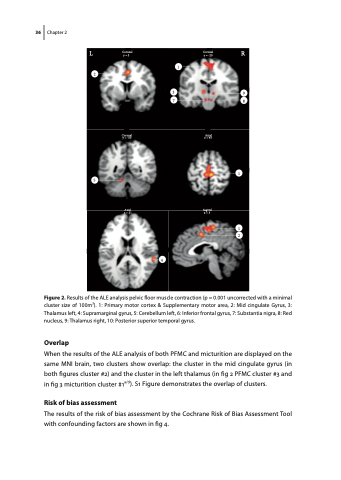
Figure 2. Results of the ALE analysis pelvic floor muscle contraction (p = 0.001 uncorrected with a minimal cluster size of 100m3). 1: Primary motor cortex & Supplementary motor area, 2: Mid cingulate Gyrus, 3: Thalamus left, 4: Supramarginal gyrus, 5: Cerebellum left, 6: Inferior frontal gyrus, 7: Substantia nigra, 8: Red nucleus, 9: Thalamus right, 10: Posterior superior temporal gyrus.
Overlap
When the results of the ALE analysis of both PFMC and micturition are displayed on the same MNI brain, two clusters show overlap: the cluster in the mid cingulate gyrus (in both figures cluster #2) and the cluster in the left thalamus (in fig 2 PFMC cluster #3 and in fig 3 micturition cluster #1a/d). S1 Figure demonstrates the overlap of clusters.
Risk of bias assessment
The results of the risk of bias assessment by the Cochrane Risk of Bias Assessment Tool with confounding factors are shown in fig 4.
