
Page 40 - Bladder Dysfunction in the Context of the Bladder-Brain Connection - Ilse Groenendijk.pdf
P. 40
38
Chapter 2
Coronal L y = -30
Coronal y = -23
R
1a/d
2 1a/d
4 1a/d
5
3
Saggital x = 4
Axial z = 38
1c 1b
1c 1b
7
Saggital x = -7
Axial z = 5
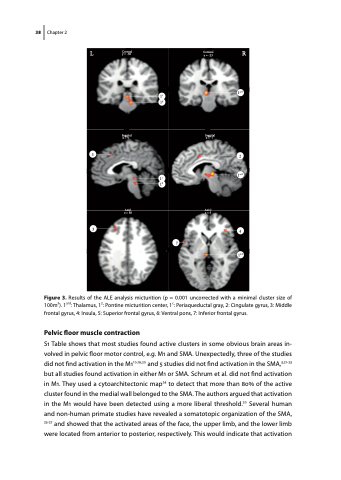
Figure 3. Results of the ALE analysis micturition (p = 0.001 uncorrected with a minimal cluster size of 100m3). 1a/d: Thalamus, 12: Pontine micturition center, 1c: Periaqueductal gray, 2: Cingulate gyrus, 3: Middle frontal gyrus, 4: Insula, 5: Superior frontal gyrus, 6: Ventral pons, 7: Inferior frontal gyrus.
Pelvic floor muscle contraction
S1 Table shows that most studies found active clusters in some obvious brain areas in- volved in pelvic floor motor control, e.g. M1 and SMA. Unexpectedly, three of the studies did not find activation in the M110,19,20 and 5 studies did not find activation in the SMA,3,21-23 but all studies found activation in either M1 or SMA. Schrum et al. did not find activation in M1. They used a cytoarchitectonic map24 to detect that more than 80% of the active cluster found in the medial wall belonged to the SMA. The authors argued that activation in the M1 would have been detected using a more liberal threshold.20 Several human and non-human primate studies have revealed a somatotopic organization of the SMA, 25-27 and showed that the activated areas of the face, the upper limb, and the lower limb were located from anterior to posterior, respectively. This would indicate that activation
