
Page 33 - Bladder Dysfunction in the Context of the Bladder-Brain Connection - Ilse Groenendijk.pdf
P. 33
A systematic review and meta-analysis of the central innervation of the lower urinary tract 31
Cochrane, EMBASE, Medline, PubMed, Scopus, Web of Science Core Collection
Date of search: until 12 July 2016
(n = 4377)
Cochrane, EMBASE, Medline, PubMed, Scopus, Web of Science Core Collection
Date of update search: 12 July 2016 until 28 March 2019
(n = 1339)
2
Records title & abstract screened
n = 5718
Records excluded n = 5567
- Removing duplicates
- Not on neuroimaging of the LUT - Systematic reviews
Full-text selection
n = 151
Additional records identified through citation sources and manual search (n = 2)
Records excluded n = 132
- No fMRI or PET (n = 57)
- Sensory control of the LUT (n = 23) - No coordinates given (n = 2)
- Not performing a task (n = 41)
- Other subject (n = 4)
- Case report/conf abstract (n = 5)
Included studies n = 19 fMRI n = 15
PET n = 4
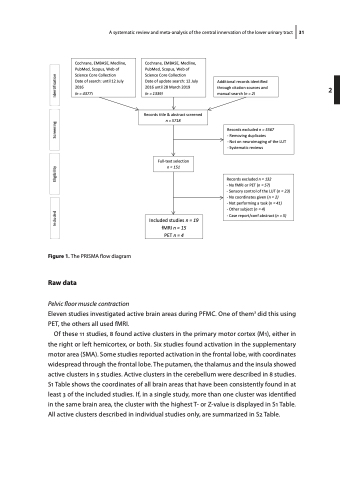
Figure 1. The PRISMA flow diagram
Figure 1. The PRISMA flow diagram
Raw data
Pelvic floor muscle contraction
Eleven studies investigated active brain areas during PFMC. One of them3 did this using PET, the others all used fMRI.
Of these 11 studies, 8 found active clusters in the primary motor cortex (M1), either in the right or left hemicortex, or both. Six studies found activation in the supplementary motor area (SMA). Some studies reported activation in the frontal lobe, with coordinates widespread through the frontal lobe. The putamen, the thalamus and the insula showed active clusters in 5 studies. Active clusters in the cerebellum were described in 8 studies. S1 Table shows the coordinates of all brain areas that have been consistently found in at least 3 of the included studies. If, in a single study, more than one cluster was identified in the same brain area, the cluster with the highest T- or Z-value is displayed in S1 Table. All active clusters described in individual studies only, are summarized in S2 Table.
Included Eligibility Screening Identification
