
Page 43 - Peri-implant health: the effect of implant design and surgical procedure on bone and soft tissue stability
P. 43
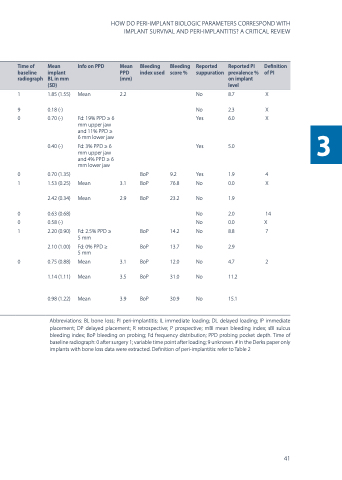
   Time of baseline radiograph
  Mean implant BL in mm (SD)
  Info on PPD
  Mean PPD (mm)
  Bleeding index used
  Bleeding score %
  Reported suppuration
  Reported PI prevalence % on implant level
  Definition of PI
  3
                                HOW DO PERI-IMPLANT BIOLOGIC PARAMETERS CORRESPOND WITH IMPLANT SURVIVAL AND PERI-IMPLANTITIS? A CRITICAL REVIEW
 1 1.85 (1.55) Mean 2.2
9 0.18 (-)
0 0.70 (-) Fd: 19% PPD ≥ 6 mm upper jaw
and 11% PPD ≥ 6 mm lower jaw
0.40 (-) Fd: 3% PPD ≥ 6 mm upper jaw
and 4% PPD ≥ 6 mm lower jaw
0 0.70 (1.35) BoP
1 1.53 (0.25) Mean 3.1 BoP
2.42 (0.34) Mean 2.9 BoP
0 0.63 (0.68)
0 0.58 (-)
1 2.20 (0.90) Fd: 2.5% PPD ≥ BoP
5 mm
2.10 (1.00) Fd: 0% PPD ≥ BoP 5 mm
0 0.75 (0.88) Mean 3.1 BoP 1.14 (1.11) Mean 3.5 BoP
0.98 (1.22) Mean 3.9 BoP
No 8.7 X
No 2.3 X Yes 6.0 X
Yes 5.0
9.2 Yes 1.9 4 76.8 No 0.0 X
23.2 No 1.9
No 2.0 14
No 0.0 X 14.2 No 8.8 7
13.7 No 2.9
12.0 No 4.7 2 31.0 No 11.2
30.9 No 15.1
 Abbreviations: BL bone loss; PI peri-implantitis; IL immediate loading; DL delayed loading; IP immediate placement; DP delayed placement; R retrospective; P prospective; mBI mean bleeding index; sBI sulcus bleeding index; BoP bleeding on probing; Fd frequency distribution; PPD probing pocket depth. Time of baseline radiograph: 0 after surgery 1; variable time point after loading; 9 unknown. # In the Derks paper only implants with bone loss data were extracted. Definition of peri-implantitis: refer to Table 2
41
