
Page 45 - Peri-implant health: the effect of implant design and surgical procedure on bone and soft tissue stability
P. 45
HOW DO PERI-IMPLANT BIOLOGIC PARAMETERS CORRESPOND WITH IMPLANT SURVIVAL AND PERI-IMPLANTITIS? A CRITICAL REVIEW
Table 3. Number of papers and the respectively reported clinical parameters
Bone loss (BL) 41 Survival rate (SR) 38 Bleeding (B) 28 Probing pocket depth (PPD) 25 Suppuration (S) 8 Bone loss, survival rate and B + PPD + S 1 Bone loss, survival rate and 2 of the 3 parameters 21 Bone loss, survival rate and 1 of the 3 parameter 8 Bone loss and survival rate 8 Bone loss and B + PPD + S 1 Bone loss and 2 of the 3 parameters 2
Mean bone loss
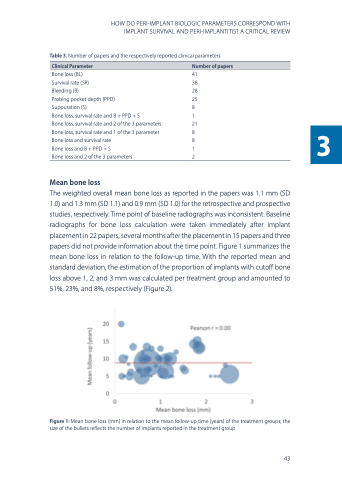
The weighted overall mean bone loss as reported in the papers was 1.1 mm (SD 1.0) and 1.3 mm (SD 1.1) and 0.9 mm (SD 1.0) for the retrospective and prospective studies, respectively. Time point of baseline radiographs was inconsistent. Baseline radiographs for bone loss calculation were taken immediately after implant placement in 22 papers, several months after the placement in 15 papers and three papers did not provide information about the time point. Figure 1 summarizes the mean bone loss in relation to the follow‐up time. With the reported mean and standard deviation, the estimation of the proportion of implants with cutoff bone loss above 1, 2, and 3 mm was calculated per treatment group and amounted to 51%, 23%, and 8%, respectively (Figure 2).
Figure 1: Mean bone loss (mm) in relation to the mean follow-up time (years) of the treatment groups; the size of the bullets reflects the number of implants reported in the treatment group
Clinical Parameter
Number of papers
43
3
