
Page 41 - Peri-implant health: the effect of implant design and surgical procedure on bone and soft tissue stability
P. 41
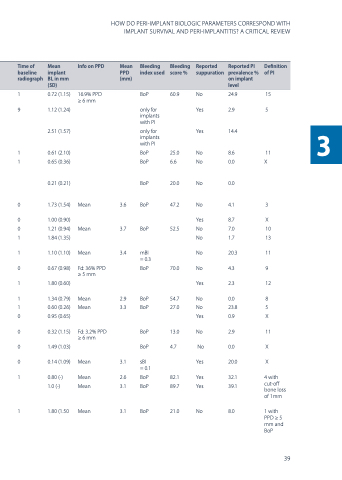
   Time of baseline radiograph
  Mean implant BL in mm (SD)
  Info on PPD
  Mean PPD (mm)
  Bleeding index used
  Bleeding score %
  Reported suppuration
  Reported PI prevalence % on implant level
  Definition of PI
  3
                                1 0.72 (1.15) 9 1.12 (1.24)
2.51 (1.57)
1 0.61 (2.10) 1 0.65 (0.36)
0.21 (0.21)
0 1.73 (1.54)
0 1.00 (0.90)
0 1.21 (0.94)
1 1.84 (1.35)
1 1.10 (1.10)
0 0.67 (0.98)
1 1.80 (0.60)
1 1.34 (0.79) 1 0.60 (0.26) 0 0.95 (0.65)
0 0.32 (1.15) 0 1.49 (1.03)
0 0.14 (1.09)
1 0.80 (-)
1.0 (-)
1 1.80 (1.50
16.9% PPD ≥ 6 mm
BoP 60.9 No 24.9
only for Yes 2.9 implants
with PI
only for Yes 14.4 implants
with PI
BoP 25.0 No 8.6 BoP 6.6 No 0.0
BoP 20.0 No 0.0
BoP 47.2 No 4.1
Yes 8.7 BoP 52.5 No 7.0 No 1.7
mBI No 20.3 = 0.3
BoP 70.0 No 4.3
Yes 2.3
BoP 54.7 No 0.0 BoP 27.0 No 23.8
Yes 0.9 BoP 13.0 No 2.9 BoP 4.7 No 0.0
sBI Yes 20.0 = 0.1
BoP 82.1 Yes 32.1 BoP 89.7 Yes 39.1
BoP 21.0 No 8.0
15 5
11 X
3
X 10 13
11
9
12
8 5 X
11 X X
4 with cut-off bone loss of 1mm
1 with PPD ≥ 5 mm and BoP
Mean 3.6
Mean 3.7
Mean 3.4
Fd: 36% PPD ≥ 5 mm
Mean 2.9 Mean 3.3
Fd: 3.2% PPD ≥ 6 mm
Mean 3.1
Mean 2.6 Mean 3.1
Mean 3.1
HOW DO PERI-IMPLANT BIOLOGIC PARAMETERS CORRESPOND WITH IMPLANT SURVIVAL AND PERI-IMPLANTITIS? A CRITICAL REVIEW
 39
