
Page 123 - Molecular features of low-grade developmental brain tumours
P. 123
THE CODING AND NON-CODING TRANSCRIPTIONAL LANDSCAPE OF SEGA
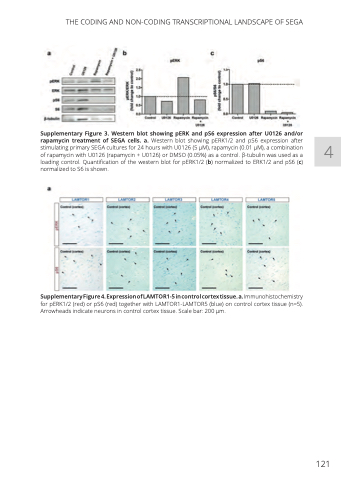
Supplementary Figure 3. Western blot showing pERK and pS6 expression after U0126 and/or rapamycin treatment of SEGA cells. a. Western blot showing pERK1/2 and pS6 expression after stimulating primary SEGA cultures for 24 hours with U0126 (5 μM), rapamycin (0.01 μM), a combination of rapamycin with U0126 (rapamycin + U0126) or DMSO (0.05%) as a control. β-tubulin was used as a loading control. Quantification of the western blot for pERK1/2 (b) normalized to ERK1/2 and pS6 (c) normalized to S6 is shown.
Supplementary Figure 4. Expression of LAMTOR1-5 in control cortex tissue. a. Immunohistochemistry for pERK1/2 (red) or pS6 (red) together with LAMTOR1-LAMTOR5 (blue) on control cortex tissue (n=5). Arrowheads indicate neurons in control cortex tissue. Scale bar: 200 μm.
121
4
