
Page 122 - Molecular features of low-grade developmental brain tumours
P. 122
4
120
CHAPTER 4
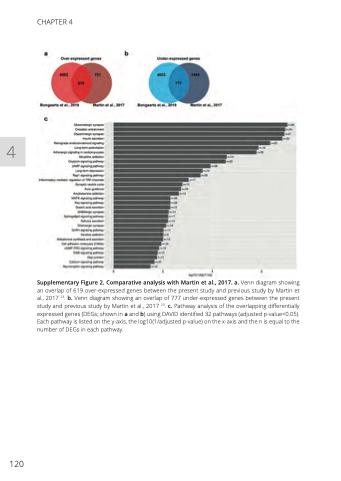
Supplementary Figure 2. Comparative analysis with Martin et al., 2017. a. Venn diagram showing an overlap of 619 over-expressed genes between the present study and previous study by Martin et al., 2017 23. b. Venn diagram showing an overlap of 777 under-expressed genes between the present study and previous study by Martin et al., 2017 23. c. Pathway analysis of the overlapping differentially expressed genes (DEGs; shown in a and b) using DAVID identified 32 pathways (adjusted p-value<0.05). Each pathway is listed on the y-axis, the log10(1/adjusted p-value) on the x-axis and the n is equal to the number of DEGs in each pathway.
