
Page 52 - Demo
P. 52
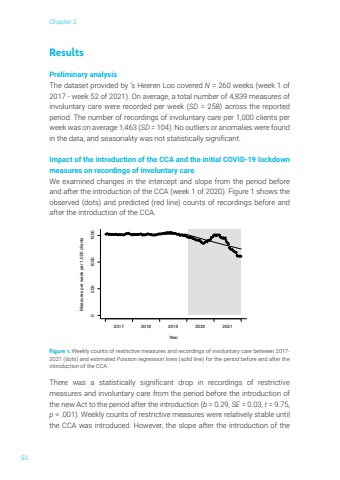
Chapter 250ResultsPreliminary analysisThe dataset provided by %u2018s Heeren Loo covered N = 260 weeks (week 1 of 2017 - week 52 of 2021). On average, a total number of 4,839 measures of involuntary care were recorded per week (SD = 258) across the reported period. The number of recordings of involuntary care per 1,000 clients per week was on average 1,463 (SD = 104). No outliers or anomalies were found in the data, and seasonality was not statistically significant.Impact of the introduction of the CCA and the initial COVID-19 lockdown measures on recordings of involuntary careWe examined changes in the intercept and slope from the period before and after the introduction of the CCA (week 1 of 2020). Figure 1 shows the observed (dots) and predicted (red line) counts of recordings before and after the introduction of the CCA.0 500 1000 1500YearMeasures per week per 1,000 clients2017 2018 2019 2020 2021Figure 1. Weekly counts of restrictive measures and recordings of involuntary care between 2017-2021 (dots) and estimated Poisson regression lines (solid line) for the period before and after the introduction of the CCA.There was a statistically significant drop in recordings of restrictive measures and involuntary care from the period before the introduction of the new Act to the period after the introduction (b = 0.29, SE = 0.03, t = 9.75, p < .001). Weekly counts of restrictive measures were relatively stable until the CCA was introduced. However, the slope after the introduction of the
