
Page 169 - Demo
P. 169
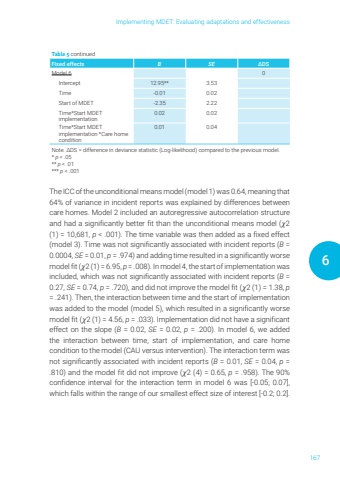
Implementing MDET: Evaluating adaptations and effectiveness1676Table 5 continuedFixed effects B SE %u0394DSModel 6 0Intercept 12.95** 3.53Time -0.01 0.02Start of MDET -2.35 2.22Time*Start MDET implementation0.02 0.02Time*Start MDET implementation *Care home condition0.01 0.04Note. %u0394DS = difference in deviance statistic (Log-likelihood) compared to the previous model.* p < .05 ** p < .01 *** p < .001The ICC of the unconditional means model (model 1) was 0.64, meaning that 64% of variance in incident reports was explained by differences between care homes. Model 2 included an autoregressive autocorrelation structure and had a significantly better fit than the unconditional means model (%ud835%udf122 (1) = 10,681, p < .001). The time variable was then added as a fixed effect (model 3). Time was not significantly associated with incident reports (B = 0.0004, SE = 0.01, p = .974) and adding time resulted in a significantly worse model fit (%ud835%udf122 (1) = 6.95, p = .008). In model 4, the start of implementation was included, which was not significantly associated with incident reports (B = 0.27, SE = 0.74, p = .720), and did not improve the model fit (%ud835%udf122 (1) = 1.38, p= .241). Then, the interaction between time and the start of implementation was added to the model (model 5), which resulted in a significantly worse model fit (%ud835%udf122 (1) = 4.56, p = .033). Implementation did not have a significant effect on the slope (B = 0.02, SE = 0.02, p = .200). In model 6, we added the interaction between time, start of implementation, and care home condition to the model (CAU versus intervention). The interaction term was not significantly associated with incident reports (B = 0.01, SE = 0.04, p = .810) and the model fit did not improve (%ud835%udf122 (4) = 0.65, p = .958). The 90% confidence interval for the interaction term in model 6 was [-0.05; 0.07], which falls within the range of our smallest effect size of interest [-0.2; 0.2].%u2003
