
Page 165 - Demo
P. 165
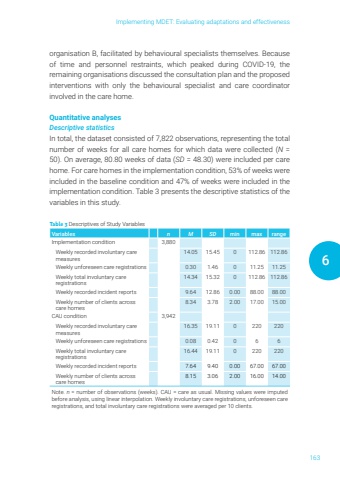
Implementing MDET: Evaluating adaptations and effectiveness1636organisation B, facilitated by behavioural specialists themselves. Because of time and personnel restraints, which peaked during COVID-19, the remaining organisations discussed the consultation plan and the proposed interventions with only the behavioural specialist and care coordinator involved in the care home.Quantitative analysesDescriptive statisticsIn total, the dataset consisted of 7,822 observations, representing the total number of weeks for all care homes for which data were collected (N = 50). On average, 80.80 weeks of data (SD = 48.30) were included per care home. For care homes in the implementation condition, 53% of weeks were included in the baseline condition and 47% of weeks were included in the implementation condition. Table 3 presents the descriptive statistics of the variables in this study. Table 3 Descriptives of Study VariablesVariables n M SD min max rangeImplementation condition 3,880Weekly recorded involuntary care measures14.05 15.45 0 112.86 112.86Weekly unforeseen care registrations 0.30 1.46 0 11.25 11.25Weekly total involuntary care registrations14.34 15.32 0 112.86 112.86Weekly recorded incident reports 9.64 12.86 0.00 88.00 88.00Weekly number of clients across care homes8.34 3.78 2.00 17.00 15.00CAU condition 3,942Weekly recorded involuntary care measures16.35 19.11 0 220 220Weekly unforeseen care registrations 0.08 0.42 0 6 6Weekly total involuntary care registrations16.44 19.11 0 220 220Weekly recorded incident reports 7.64 9.40 0.00 67.00 67.00Weekly number of clients across care homes8.15 3.06 2.00 16.00 14.00Note. n = number of observations (weeks). CAU = care as usual. Missing values were imputed before analysis, using linear interpolation. Weekly involuntary care registrations, unforeseen care registrations, and total involuntary care registrations were averaged per 10 clients.
