
Page 204 - Emotions through the eyes of our closest living relatives- Exploring attentional and behavioral mechanisms
P. 204
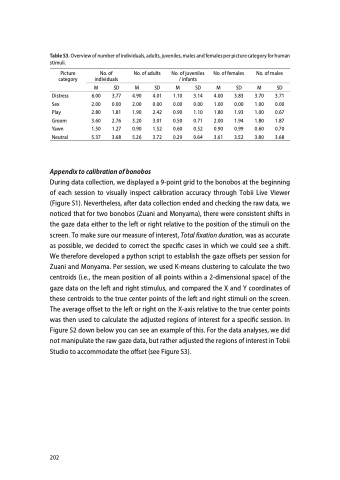
                                Table S3. Overview of number of individuals, adults, juveniles, males and females per picture category for human stimuli.
 Picture category
Distress Sex Play Groom Yawn Neutral
No. of No. of adults No. of juveniles No. of females No. of males individuals / infants
M SD M SD M SD M SD M SD
  6.00 3.77 2.00 0.00 2.80 1.81 3.60 2.76 1.50 1.27 5.37 3.68
4.90 4.01 2.00 0.00 1.90 2.42 3.20 3.01 0.90 1.52 5.26 3.72
1.10 3.14 0.00 0.00 0.90 1.10 0.50 0.71 0.60 0.52 0.29 0.64
4.00 3.83 1.00 0.00 1.80 1.93 2.00 1.94 0.90 0.99 3.61 3.52
3.70 3.71 1.00 0.00 1.00 0.67 1.80 1.87 0.60 0.70 3.80 3.68
 Appendix to calibration of bonobos
During data collection, we displayed a 9-point grid to the bonobos at the beginning of each session to visually inspect calibration accuracy through Tobii Live Viewer (Figure S1). Nevertheless, after data collection ended and checking the raw data, we noticed that for two bonobos (Zuani and Monyama), there were consistent shifts in the gaze data either to the left or right relative to the position of the stimuli on the screen. To make sure our measure of interest, Total fixation duration, was as accurate as possible, we decided to correct the specific cases in which we could see a shift. We therefore developed a python script to establish the gaze offsets per session for Zuani and Monyama. Per session, we used K-means clustering to calculate the two centroids (i.e., the mean position of all points within a 2-dimensional space) of the gaze data on the left and right stimulus, and compared the X and Y coordinates of these centroids to the true center points of the left and right stimuli on the screen. The average offset to the left or right on the X-axis relative to the true center points was then used to calculate the adjusted regions of interest for a specific session. In Figure S2 down below you can see an example of this. For the data analyses, we did not manipulate the raw gaze data, but rather adjusted the regions of interest in Tobii Studio to accommodate the offset (see Figure S3).
202
