
Page 206 - Emotions through the eyes of our closest living relatives- Exploring attentional and behavioral mechanisms
P. 206
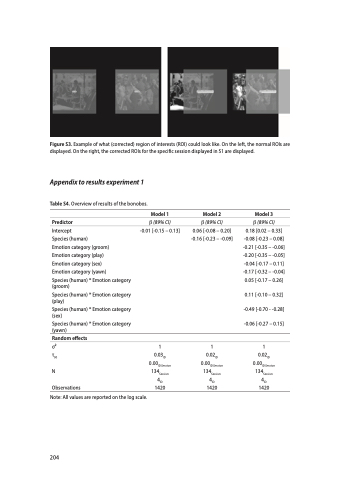
                                 Figure S3. Example of what (corrected) region of interests (ROI) could look like. On the left, the normal ROIs are displayed. On the right, the corrected ROIs for the specific session displayed in S1 are displayed.
Appendix to results experiment 1
Table S4. Overview of results of the bonobos.
  Predictor
Intercept
Species (human)
Emotion category (groom)
Emotion category (play)
Emotion category (sex)
Emotion category (yawn)
Species (human) * Emotion category (groom)
Species (human) * Emotion category (play)
Species (human) * Emotion category (sex)
Species (human) * Emotion category (yawn)
Random effects
Model 1
b (89% CI)
-0.01 [-0.15 – 0.13]
Model 2
b (89% CI)
0.06 [-0.08 – 0.20] -0.16 [-0.23 – -0.09]
Model 3
b (89% CI)
0.18 [0.02 – 0.33] -0.08 [-0.23 – 0.08] -0.21 [-0.35 – -0.06] -0.20 [-0.35 – -0.05] -0.04 [-0.17 – 0.11] -0.17 [-0.32 – -0.04] 0.05 [-0.17 – 0.26]
0.11 [-0.10 – 0.32] -0.49 [-0.70 - -0.28] -0.06 [-0.27 – 0.15]
   σ2 111
τ00 N
Observations
Note: All values are reported on the log scale.
0.03ID
0.00ID:Session 134Session
4ID 1420
0.02ID
0.00ID:Session 134Session
4ID 1420
0.02ID
0.00ID:Session 134Session
4ID 1420
 204
