
Page 205 - Emotions through the eyes of our closest living relatives- Exploring attentional and behavioral mechanisms
P. 205
Appendices
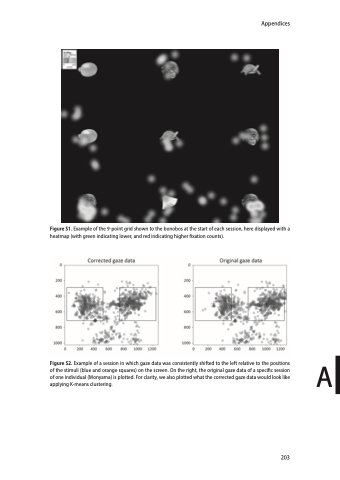
Figure S1. Example of the 9-point grid shown to the bonobos at the start of each session, here displayed with a heatmap (with green indicating lower, and red indicating higher fixation counts).
Figure S2. Example of a session in which gaze data was consistently shifted to the left relative to the positions A of the stimuli (blue and orange squares) on the screen. On the right, the original gaze data of a specific session
of one individual (Monyama) is plotted. For clarity, we also plotted what the corrected gaze data would look like
applying K-means clustering.
203
