
Page 199 - Emotions through the eyes of our closest living relatives- Exploring attentional and behavioral mechanisms
P. 199
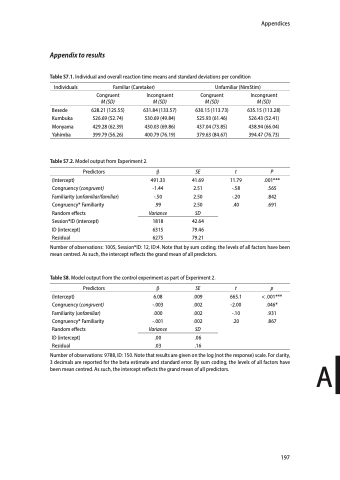
                                Appendix to results
Table S7.1. Individual and overall reaction time means and standard deviations per condition
Congruent
M (SD)
628.21 (125.55) 526.69 (52.74) 429.28 (62.39) 399.79 (56.26)
Incongruent
M (SD)
631.84 (133.57) 530.69 (49.84) 430.03 (69.86) 400.79 (76.19)
Congruent
M (SD)
630.15 (113.73) 525.93 (61.46) 437.04 (73.85) 379.63 (84.67)
SE t
41.69 11.79 2.51 -.58 2.50 -.20 2.50 .40
SD
42.64 79.46 79.21
Incongruent
M (SD)
635.15 (113.28) 526.43 (52.41) 438.94 (66.04) 394.47 (76.73)
P
.001*** .565 .842 .691
Appendices
 Individuals
Besede Kumbuka Monyama Yahimba
Familiar (Caretaker)
Unfamiliar (NimStim)
   Table S7.2. Model output from Experiment 2.
Predictors
(Intercept)
Congruency (congruent) Familiarity (unfamiliar/familiar) Congruency* Familiarity Random effects
Session*ID (intercept)
ID (intercept)
Residual
b
491.33 -1.44 -.50 .99 Variance
1818 6315 6275
    Number of observations: 1005, Session*ID: 12, ID:4. Note that by sum coding, the levels of all factors have been mean centred. As such, the intercept reflects the grand mean of all predictors.
Table S8. Model output from the control experiment as part of Experiment 2.
 Predictors
(Intercept)
Congruency (congruent) Familiarity (unfamiliar) Congruency* Familiarity Random effects
ID (intercept)
Residual
b SE t p
6.08 .009 665.1 < .001*** -.003 .002 -2.00 .046* .000 .002 -.10 .931
-.001 .002 .20 .867
Variance SD
.00 .06 .03 .16
   Number of observations: 9788, ID: 150. Note that results are given on the log (not the response) scale. For clarity,
3 decimals are reported for the beta estimate and standard error. By sum coding, the levels of all factors have A been mean centred. As such, the intercept reflects the grand mean of all predictors.
 197
