
Page 198 - Emotions through the eyes of our closest living relatives- Exploring attentional and behavioral mechanisms
P. 198
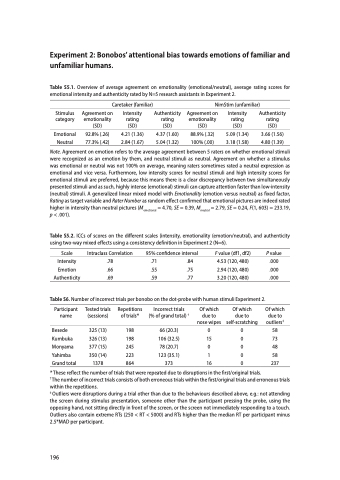
                                Experiment 2: Bonobos’ attentional bias towards emotions of familiar and unfamiliar humans.
Table S5.1. Overview of average agreement on emotionality (emotional/neutral), average rating scores for emotional intensity and authenticity rated by N=5 research assistants in Experiment 2.
 Caretaker (familiar)
NimStim (unfamiliar)
 Stimulus category
Emotional Neutral
Agreement on emotionality (SD)
92.8% (.26) 77.3% (.42)
Intensity rating (SD)
4.21 (1.36) 2.84 (1.67)
Authenticity rating (SD)
4.37 (1.60) 5.04 (1.32)
Agreement on emotionality (SD)
88.9% (.32) 100% (.00)
Intensity rating (SD)
5.09 (1.34) 3.18 (1.58)
Authenticity rating (SD)
3.66 (1.56) 4.80 (1.39)
  Note. Agreement on emotion refers to the average agreement between 5 raters on whether emotional stimuli were recognized as an emotion by them, and neutral stimuli as neutral. Agreement on whether a stimulus was emotional or neutral was not 100% on average, meaning raters sometimes rated a neutral expression as emotional and vice versa. Furthermore, low intensity scores for neutral stimuli and high intensity scores for emotional stimuli are preferred, because this means there is a clear discrepancy between two simultaneously presented stimuli and as such, highly intense (emotional) stimuli can capture attention faster than low-intensity (neutral) stimuli. A generalized linear mixed model with Emotionality (emotion versus neutral) as fixed factor, Rating as target variable and Rater Number as random effect confirmed that emotional pictures are indeed rated higher in intensity than neutral pictures (Memotional = 4.70, SE = 0.39, Mneutral = 2.79, SE = 0.24, F(1, 603) = 233.19, p < .001).
Table S5.2. ICCs of scores on the different scales (intensity, emotionality (emotion/neutral), and authenticity using two-way mixed effects using a consistency definition in Experiment 2 (N=6).
 Scale
Intensity
Emotion Authenticity
Intraclass Correlation 95% confidence interval
F value (df1, df2)
4.53 (120, 480) 2.94 (120, 480) 3.20 (120, 480)
P value
.000 .000 .000
 .78 .71 .66 .55 .69 .59
.84 .75 .77
 Table S6. Number of incorrect trials per bonobo on the dot-probe with human stimuli Experiment 2.
  Participant name
Besede Kumbuka Monyama Yahimba Grand total
Tested trials (sessions)
325 (13) 326 (13) 377 (15) 350 (14) 1378
Repetitions of trials*
198 198 245 223 864
Incorrect trials (% of grand total) †
66 (20.3) 106 (32.5) 78 (20.7) 123 (35.1) 373
Of which due to nose wipes
0 15 0 1 16
Of which due to self-scratching
0 0 0 0 0
Of which due to outliers‡
58 73 48 58 237
    * These reflect the number of trials that were repeated due to disruptions in the first/original trials.
† The number of incorrect trials consists of both erroneous trials within the first/original trials and erroneous trials within the repetitions.
‡ Outliers were disruptions during a trial other than due to the behaviours described above, e.g.: not attending the screen during stimulus presentation, someone other than the participant pressing the probe, using the opposing hand, not sitting directly in front of the screen, or the screen not immediately responding to a touch. Outliers also contain extreme RTs (250 < RT < 5000) and RTs higher than the median RT per participant minus 2.5*MAD per participant.
196
