
Page 201 - Emotions through the eyes of our closest living relatives- Exploring attentional and behavioral mechanisms
P. 201
Appendix to stimulus validation
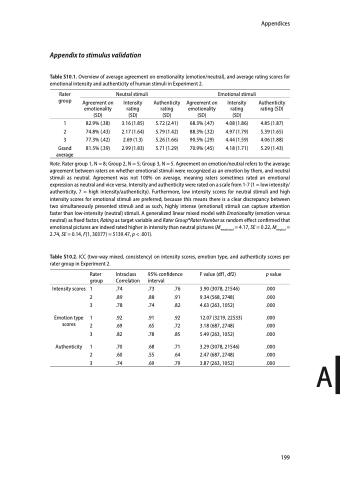
Table S10.1. Overview of average agreement on emotionality (emotion/neutral), and average rating scores for emotional intensity and authenticity of human stimuli in Experiment 2.
Appendices
Rater group
1
2
3
Grand average
Agreement on emotionality (SD)
82.9% (.38) 74.8% (.43) 77.3% (.42) 81.5% (.39)
Neutral stimuli
Intensity rating (SD)
3.16 (1.85) 2.17 (1.64) 2.69 (1.3) 2.99 (1.83)
Authenticity rating (SD)
5.72 (2.41) 5.79 (1.42) 5.26 (1.66) 5.71 (1.29)
Agreement on emotionality (SD)
68.3% (.47) 88.3% (.32) 90.5% (.29) 70.9% (.45)
Emotional stimuli
Intensity rating (SD)
4.08 (1.86) 4.97 (1.79) 4.44 (1.59) 4.18 (1.71)
Authenticity rating (SD)
4.85 (1.87) 5.39 (1.65) 4.06 (1.88) 5.29 (1.43)
Note. Rater group 1, N = 8; Group 2, N = 5; Group 3, N = 5. Agreement on emotion/neutral refers to the average agreement between raters on whether emotional stimuli were recognized as an emotion by them, and neutral stimuli as neutral. Agreement was not 100% on average, meaning raters sometimes rated an emotional expression as neutral and vice versa. Intensity and authenticity were rated on a scale from 1-7 (1 = low intensity/ authenticity, 7 = high intensity/authenticity). Furthermore, low intensity scores for neutral stimuli and high intensity scores for emotional stimuli are preferred, because this means there is a clear discrepancy between two simultaneously presented stimuli and as such, highly intense (emotional) stimuli can capture attention faster than low-intensity (neutral) stimuli. A generalized linear mixed model with Emotionality (emotion versus neutral) as fixed factor, Rating as target variable and Rater Group*Rater Number as random effect confirmed that emotional pictures are indeed rated higher in intensity than neutral pictures (Memotional = 4.17, SE = 0.22, Mneutral = 2.74, SE = 0.14, F(1, 30377) = 5139.47, p < .001).
Table S10.2. ICC (two-way mixed, consistency) on intensity scores, emotion type, and authenticity scores per rater group in Experiment 2.
Rater Intraclass group Correlation
95% confidence interval
.76 .91 .82
.92 .72 .85
.71 .64 .79
F value (df1, df2) p value
3.90 (3078, 21546) .000 9.34 (568, 2748) .000 4.63 (263, 1052) .000
12.07 (3219, 22533) .000 3.18 (687, 2748) .000 5.49 (263, 1052) .000
3.29 (3078, 21546) .000 2.47 (687, 2748) .000 3.87 (263, 1052) .000
.74 .73 3 .78 .74
Emotion type 1
scores
Intensity scores 1
2 .89 .88
.92 .91
2 .69 .65
3 .82 .78
.70 .68 3 .74 .69
Authenticity 1
2 .60 .55
A
199
