
Page 196 - Emotions through the eyes of our closest living relatives- Exploring attentional and behavioral mechanisms
P. 196
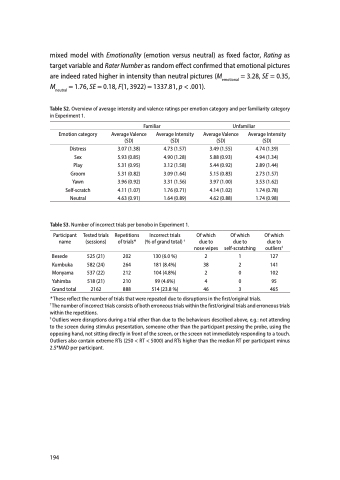
                                mixed model with Emotionality (emotion versus neutral) as fixed factor, Rating as target variable and Rater Number as random effect confirmed that emotional pictures are indeed rated higher in intensity than neutral pictures (Memotional = 3.28, SE = 0.35, Mneutral = 1.76, SE = 0.18, F(1, 3922) = 1337.81, p < .001).
Table S2. Overview of average intensity and valence ratings per emotion category and per familiarity category in Experiment 1.
 Emotion category
Distress Sex Play Groom Yawn Self-scratch Neutral
Average Valence (SD)
3.07 (1.38) 5.93 (0.85) 5.31 (0.95) 5.31 (0.82) 3.96 (0.92) 4.11 (1.07) 4.63 (0.91)
Average Intensity (SD)
4.73 (1.57) 4.90 (1.28) 3.12 (1.58) 3.09 (1.64) 3.31 (1.56) 1.76 (0.71) 1.64 (0.89)
Average Valence (SD)
Average Intensity (SD)
4.74 (1.39) 4.94 (1.34) 2.89 (1.44) 2.73 (1.57) 3.53 (1.62) 1.74 (0.78) 1.74 (0.98)
Familiar
Unfamiliar
  3.49 5.88 5.44 5.15 3.97 4.14 4.62
Of which due to nose wipes
2 38 2 4 46
(1.55) (0.93) (0.92) (0.83) (1.00) (1.02) (0.88)
 Table S3. Number of incorrect trials per bonobo in Experiment 1.
  Participant name
Besede Kumbuka Monyama Yahimba Grand total
Tested trials (sessions)
525 (21) 582 (24) 537 (22) 518 (21) 2162
Repetitions of trials*
202 264 212 210 888
Incorrect trials (% of grand total) †
130 (6.0 %) 181 (8.4%) 104 (4.8%) 99 (4.6%) 514 (23.8 %)
Of which due to self-scratching
1 2 0 0 3
Of which due to outliers‡
127 141 102 95 465
    * These reflect the number of trials that were repeated due to disruptions in the first/original trials.
† The number of incorrect trials consists of both erroneous trials within the first/original trials and erroneous trials within the repetitions.
‡ Outliers were disruptions during a trial other than due to the behaviours described above, e.g.: not attending to the screen during stimulus presentation, someone other than the participant pressing the probe, using the opposing hand, not sitting directly in front of the screen, or the screen not immediately responding to a touch. Outliers also contain extreme RTs (250 < RT < 5000) and RTs higher than the median RT per participant minus 2.5*MAD per participant.
194
