
Page 36 - Epidemiological studies on tuberculosis control and respiratory viruses
P. 36
Chapter 6
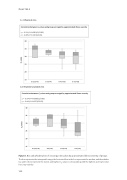
1.c. Influenza A virus
Correlation between Cp values and groups arranged by approximated illness severity
rs = -0.311, P=0.020 (G1/2-G5) rs = -0.205, P=0.152 (G3-G5)
40 35 30 25 20 15
G-1/2 (n=6)
G-3 (n=4)
G-4 (n=26)
G-5 (n=20)
1.d. Respiratory syncytial virus
Correlation between Cp values and groups arranged by approximated illness severity
rs = -0.374, P=0.038 (G1/2-G5) rs = -0.441, P=0.027 (G3-G5)
40 35 30 25 20 15
G-1/2 (n=6)
G-3 (n=8)
G-4 (n=11)
G-5 (n=6)
Figure 1. Box and whisker plots of crossing point values by approximated illness severity of groups
The box represents the interquartile range, the horizontal line in the box represents the median, and the whisker top and bottom represent the lowest and highest Cp values (corresponding with the highest and lowest viral load, respectively).
106
Cp value
Cp value
