
Page 34 - Epidemiological studies on tuberculosis control and respiratory viruses
P. 34
Chapter 6
104
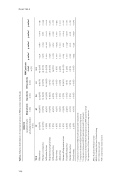
Table 2. Relative distribution of respiratory viruses in PCR-positive individuals
Total
75
47
84
69
200
Rhinovirus
Human coronavirus Influenza A virus Respiratory syncytial virus Influenza B virus Enterovirus
Adenovirus
Human Metapneumovirus Parainfluenzavirus Human Bocavirus Parechovirus
28 (37%) 20 (27%) 6 (8%) 6 (8%) 1 (1%) 1 (1%) 1 (1%) 1 (1%) 4 (5%) 5 (7%) 2 (3%)
13 (28%) 8 (17%) 4 (9%) 8 (17%) 4 (9%) 1 (2%) 1 (2%) 6 (13%) 2 (4%) 0 (0%) 0 (0%)
23 (27%) 12 (14%) 26 (31%) 11 (13%) 4 (5%) 0 (0%)
13 (19%) 12 (17%) 20 (29%) 6 (9%) 6 (9%) 0 (0%) 2 (3%) 8 (12%) 1 (1%) 1 (1%) 0 (0%)
49 (25%) 32 (16%) 50 (25%) 25 (13%) 14 (7%) 1 (1%)
0.271 0.218 1.000 0.128 0.072 1.000 1.000 0.013 1.000 0.155 0.522
0.180
0.014 0.035 0.181 0.044 0.001 0.002 0.880 0.293 0.055 0.077 1.000 0.472 0.607 1.000 0.014 0.016 0.368 0.091 0.211 0.018 0.497 0.074
1 Comparison between HELIUS participants and Outpatients
2 Comparison between HELIUS participants and Inpatients
3 Comparison between HELIUS participants and ICU patients
4 Comparison between HELIUS participants and AMC patients (total) Chi-squared test or Fisher exact test were used for comparisons.
AMC= Academic Medical Center HELIUS= Healthy Life In an Urban Setting ICU = Intensive care unit
PCR = polymerase chain reaction
HELIUS
Outpatients
Inpatients
ICU patients
AMC patients -total-
n (%)
(asymptomatic and symptomatic) n (%)
n (%)
n (%)
n (%)
p-value1
p-value2
p-value3 p-value4
1 (1%) 6 (7%) 0 (0%) 1 (1%) 0 (0%)
4 (2%) 20 (10%) 3 (2%) 2 (1%) 0 (0%)
0.052 <0.001 0.299 0.216 0.472 1.000 0.121 0.047 0.101 0.221
