
Page 37 - Epidemiological studies on tuberculosis control and respiratory viruses
P. 37
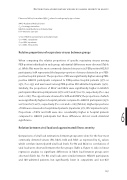
Distribution of respiratory viruses by illness severity in adults
Please see Table 3 for median (IQR) Cp values for each group, by type of virus.
AMC= Academic Medical Center
Cp = Crossing point values
HELIUS= Healthy Life In an Urban Setting ICU= Intensive care unit
G-1/2 = HELIUS, asymptomatic and symptomatic G-3 = AMC, outpatients
G-4 = AMC, inpatients
G-5 = AMC, ICU patients
Relative proportions of respiratory viruses between groups
When comparing the relative proportions of specific respiratory viruses among
PCR-positive individuals in each group, substantial differences were observed (Table
2). While RVs were the most commonly detected viruses in 75 PCR-positive HELIUS
participants, InfA represented the largest proportion of viruses detected in 200 PCR-
positive hospital patients. The proportion of RV was significantly higher among PCR-
positive HELIUS participants compared to PCR-positive hospital patients (37% vs
25%, P=0.035) and was lowest among PCR-positive ICU-admitted inpatients (19%).
Similarly, the proportions of hCoV and hBoV were significantly higher in HELIUS
participants than in hospital patients (27% vs 16% and 7% vs 1%, respectively (P=0.044
and 0.018)). The opposite was observed for InfA and hMPV, the proportions of which
were significantly higher in hospital patients compared to HELIUS participants (25%
vs 8% and 10% vs 1%, respectively (P=0.002 and 0.016)) (Table 2). Highest proportions
of InfA were observed in hospitalized patients (inpatients 31%, ICU inpatients 29%).
Proportions of RSV and InfB were also considerably higher in hospital patients 6 compared to HELIUS participants but these differences did not reach statistical
significance.
Relation between viral load and approximated illness severity
Comparisons of viral load estimations between groups were done for the four most commonly detected viruses (RV, hCoV, InfA and RSV) as expressed by Cp values which correlate inversely with viral load levels. For RV and hCoV, no correlations of viral load were observed between the five groups (Table 3, Figure 1). Also in linear regression analysis no significant differences in hCoV load between groups were observed (Table S2). For RV, viral loads were similar between HELIUS participants and ICU-admitted patients, but significantly lower in outpatients and non-ICU
107
