
Page 16 - Epidemiological studies on tuberculosis control and respiratory viruses
P. 16
Chapter 2
26
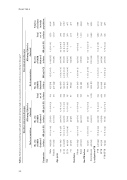
Table 2. Risk factors for clustering, with and without allowing single-locus variants to be clustered, according to lineage a
Parameter Sex
OR (95% CI)
OR (95% CI)
no. of isolates
OR (95% CI)
OR (95% CI)
no. of isolates
Age, years
Residence
Urban Rural Had TB before Yes No/unknown
165 (42) 268 (36)
1.3 (0.9-1.6) 1
237 (60) 442 (60)
1.0 (0.8-1.3) 1
393 737
601 (58) 723 (45)
1.7 (1.4-1.9) 1
721 (69) 918 (57)
1.7 (1.4-2) 1
1,040 1,606
1,433 2,343
Male Female
243 (39) 190 (37)
1.1 (0.9-1.4) 1
373 (60) 306 (60)
1.0 (0.8-1.3) 1
619 511
855 (54) 469 (44)
1.5 (1.3-1.8) 1
1,023 (65) 616 (58)
1.3 (1.1-1.6) 1
1,579 1,067
2,198 1,578
Localization of TB
<30 30-55 55-70 >70
157 (40) 202 (38) 49 (43) 25 (28)
1.7 (1.0-2.8) 1.6 (0.9-2.6) 1.9 (1.1-3.4) 1
240 (61) 323 (61) 73 (64) 43 (48)
1.7 (1.1-2.7) 1.6 (1.0-2.6) 1.9 (1.1-3.3) 1
392 534 115 89
429 (58) 645 (56) 162 (46) 88 (22)
5.1 (3.9-6.7) 4.6 (3.5-5.9) 3.1 (2.3-4.2) 1
501 (68) 771 (67) 213 (61) 154 (38)
3.5 (2.7-4.6) 3.3 (2.6-4.2) 2.5 (1.9-3.4) 1
734 1,153 352 407
1,126 1,687 467 496
PTB EPTB PTB+EPTB
228 (44) 141 (31) 64 (42)
1.8 (1.4-2.4) 1
1.6 (1.1-2.4)
332 (65) 251 (54) 96 (63)
1.5 (1.2-2.0) 1
1.4 (0.9-2.1)
514 463 153
844 (53) 303 (41) 177 (55)
1.6 (1.3-1.9) 1
1.7 (1.3-2.2)
1,026 (65) 396 (54) 217 (67)
1.5 (1.3-1.8) 1
1.7 (1.3-2.2)
1,589 732 325
2,103 1,195 478
No locus variation
Allowing SLVs to be clustered
No locus variation
Allowing SLVs to be clustered
No. (%) of VNTR clustered isolates
No. (%) of VNTR clustered isolates
Total
No. (%) of VNTR clustered isolates
No. (%) of VNTR clustered isolates
Total
Total no. of isolates in study population
12 (26) 421 (39)
0.5 (0.3-1.1) 1
25 (53) 654 (60)
0.7 (0.4-1.3) 1
47 1,083
72 (38) 1,252 (51)
0.6 (0.4-0.8) 1
89 (47) 1,550 (63)
0.5 (0.4-0.7) 1
190 2,456
237 3,539
Non-Euro-American lineages
Euro-American lineages
