
Page 40 - Development of Functional Scaffolds for Bone Tissue Engineering Using 3D-Bioprinting of Cells and Biomaterials - Yasaman Zamani
P. 40
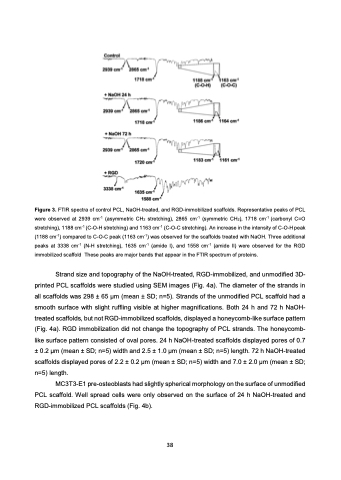
 Figure 3. FTIR spectra of control PCL, NaOH-treated, and RGD-immobilized scaffolds. Representative peaks of PCL were observed at 2939 cm-1 (asymmetric CH2 stretching), 2865 cm-1 (symmetric CH2), 1718 cm-1 (carbonyl C=O stretching), 1188 cm-1 (C-O-H stretching) and 1163 cm-1 (C-O-C stretching). An increase in the intensity of C-O-H peak (1188 cm-1) compared to C-O-C peak (1163 cm-1) was observed for the scaffolds treated with NaOH. Three additional peaks at 3338 cm-1 (N-H stretching), 1635 cm-1 (amide I), and 1558 cm-1 (amide II) were observed for the RGD immobilized scaffold These peaks are major bands that appear in the FTIR spectrum of proteins.
Strand size and topography of the NaOH-treated, RGD-immobilized, and unmodified 3D- printed PCL scaffolds were studied using SEM images (Fig. 4a). The diameter of the strands in all scaffolds was 298 ± 65 μm (mean ± SD; n=5). Strands of the unmodified PCL scaffold had a smooth surface with slight ruffling visible at higher magnifications. Both 24 h and 72 h NaOH- treated scaffolds, but not RGD-immobilized scaffolds, displayed a honeycomb-like surface pattern (Fig. 4a). RGD immobilization did not change the topography of PCL strands. The honeycomb- like surface pattern consisted of oval pores. 24 h NaOH-treated scaffolds displayed pores of 0.7 ± 0.2 μm (mean ± SD; n=5) width and 2.5 ± 1.0 μm (mean ± SD; n=5) length. 72 h NaOH-treated scaffolds displayed pores of 2.2 ± 0.2 μm (mean ± SD; n=5) width and 7.0 ± 2.0 μm (mean ± SD; n=5) length.
MC3T3-E1 pre-osteoblasts had slightly spherical morphology on the surface of unmodified PCL scaffold. Well spread cells were only observed on the surface of 24 h NaOH-treated and RGD-immobilized PCL scaffolds (Fig. 4b).
38
