
Page 50 - Fluorescence-guided cancer surgery
P. 50
48
Chapter 3
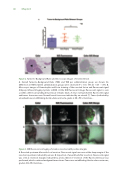
Figure 2. Tumor-to-Background Ratio and microscopic images of resected lesion
A. Overall Tumor-to-Background Ratio (TBR) and TBR per administration group are shown. No di erences in TBR between administration groups were observed (P = 0.50; 95% CI -0.49 – 0.96). B. Microscopic images of Hematoxylin and Eosin staining of the resected lesion and uorescent signal (Odyssey Infrared Imaging System, LI-COR). At the NIR uorescent image, uorescent signal is seen as white, where surrounding breast tissue remains black. A clear overlay between uorescent signal and tumor tissue was seen. Normal breast tissue was indicated by an asterisk (*). Tumor (indicated by arrowhead) was an in ltrating ductal adenocarcinoma, grade 2, ER + PR + Her2/neu -.
Figure 3. NIR uorescence imaging of a tumor resection with positive margins
A. Resected specimen after wide local excision. Fluorescent signal was seen at the deep margin of the resection specimen, indicated by arrows. B. Inspection of wound bed after resection. Fluorescent signal was seen at resection margins indicated by arrows. Direct re-resection of the uorescent tissue was performed, which contained malignant tumor tissue. Tumor was an in ltrating lobular adenocarcinoma, grade 2, ER+ PR- Her2/neu -.
