
Page 125 - Fluorescence-guided cancer surgery
P. 125
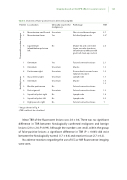
Table 3. Overview of false-positive lesions detected using ICG
Imaging based on the EPR e ect in ovarian cancer 123
Patient
Localisation
Clinically suspect for malignancy
Uncertain Yes
No
Yes Uncertain Uncertain
Uncertain Uncertain
No Uncertain No
No
No
Pathology TBR
Fibrosis and hemorrhages 2.7 Calci ed lymph node 2.9*
Mature fat and connective 2.4 tissue, vascular structures, in ammatory in ltrate with
giant cell clean-up reaction
Fat and connective tissue 2.1
Muscle 1.3
Connective tissue and some 1.6 tubulair structures
Lymph node 1.7
Muscle 1.6 1.3
Fat and connective tissue
Fat and connective tissue 1.3 Lymph node 1.8 Lymph node 2.6 Fat and connective tissue †
2 Mesenterium small bowel
3 Mesenterium ileum
6 Ligamentum infundibulum pelvicum left
1 Omentum
6 Omentum
8 Peritoneum right
8 Iliaca interna right
8 Omentum
9 Bladder peritoneum
9 Rectosigmoid
9 Super cial pelvic right 9 Super cial pelvic left 9 High paracolic right
* Image shown in Fig. 4
† TBR could not be calculated
Mean TBR of the  uorescent lesions was 2.0 ± 0.6. There was no signi cant di erence in TBR between histologically con rmed malignant and benign lesions (2.0 vs 2.0; P=0.99). Although the numbers are small, within the group of false-positive lesions a signi cant di erence in TBR (P = 0.003) did exist between the histologically normal (1.7 ± 0.4) and reactive tissue (2.7 ± 0.2).
No adverse reactions regarding the use of ICG or NIR  uorescence imaging were seen.
Healthy tissue Tissue with reactive changes
