
Page 51 - Demo
P. 51
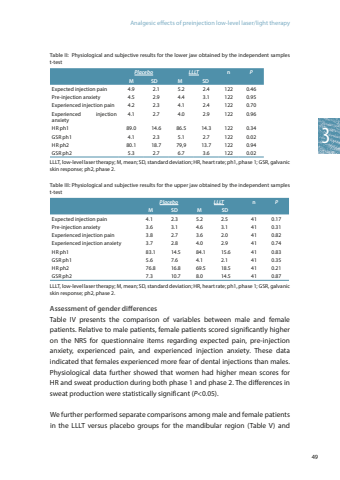
Analgesic effects of preinjection low-level laser/light therapy493Table II: Physiological and subjective results for the lower jaw obtained by the independent samples t-testPlacebo M SDLLLT M SDn PExpected injection pain 4.9 2.1 5.2 2.4 122 0.46Pre-injection anxiety 4.5 2.9 4.4 3.1 122 0.95Experienced injection pain 4.2 2.3 4.1 2.4 122 0.70Experienced injection anxiety4.1 2.7 4.0 2.9 122 0.96HR ph1 89.0 14.6 86.5 14.3 122 0.34GSR ph1 4.1 2.3 5.1 2.7 122 0.02HR ph2 80.1 18.7 79,9 13.7 122 0.94GSR ph2 5.3 2.7 6.7 3.6 122 0.02LLLT, low-level laser therapy; M, mean; SD, standard deviation; HR, heart rate; ph1, phase 1; GSR, galvanic skin response; ph2, phase 2. Table III: Physiological and subjective results for the upper jaw obtained by the independent samples t-test Placebo M SDLLLT M SDn PExpected injection pain 4.1 2.3 5.2 2.5 41 0.17Pre-injection anxiety 3.6 3.1 4.6 3.1 41 0.31Experienced injection pain 3.8 2.7 3.6 2.0 41 0.82Experienced injection anxiety 3.7 2.8 4.0 2.9 41 0.74HR ph1 83.1 14.5 84.1 15.6 41 0.83GSR ph1 5.6 7.6 4.1 2.1 41 0.35HR ph2 76.8 16.8 69.5 18.5 41 0.21GSR ph2 7.3 10.7 8.0 14.5 41 0.87LLLT, low-level laser therapy; M, mean; SD, standard deviation; HR, heart rate; ph1, phase 1; GSR, galvanic skin response; ph2, phase 2. Assessment of gender differencesTable IV presents the comparison of variables between male and female patients. Relative to male patients, female patients scored significantly higher on the NRS for questionnaire items regarding expected pain, pre-injection anxiety, experienced pain, and experienced injection anxiety. These data indicated that females experienced more fear of dental injections than males. Physiological data further showed that women had higher mean scores for HR and sweat production during both phase 1 and phase 2. The differences in sweat production were statistically significant (P<0.05). We further performed separate comparisons among male and female patients in the LLLT versus placebo groups for the mandibular region (Table V) and
