
Page 153 - Demo
P. 153
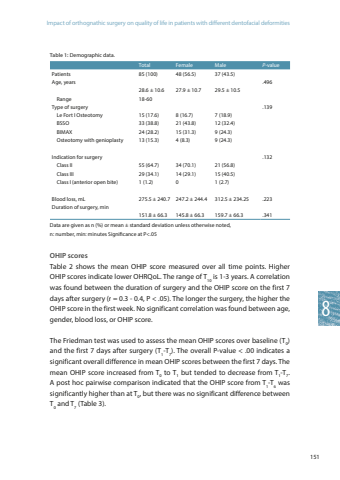
Impact of orthognathic surgery on quality of life in patients with different dentofacial deformities1518Table 1: Demographic data.Total Female Male P-valuePatients 85 (100) 48 (56.5) 37 (43.5)Age, years Range 28.6 ± 10.618-6027.9 ± 10.7 29.5 ± 10.5.496Type of surgery Le Fort I Osteotomy BSSO BIMAX Osteotomy with genioplastyIndication for surgery Class II Class III Class I (anterior open bite)Blood loss, mLDuration of surgery, min15 (17.6)33 (38.8)24 (28.2)13 (15.3)55 (64.7)29 (34.1)1 (1.2)275.5 ± 240.7 151.8 ± 66.38 (16.7)21 (43.8)15 (31.3)4 (8.3)34 (70.1)14 (29.1)0 247.2 ± 244.4145.8 ± 66.37 (18.9)12 (32.4)9 (24.3)9 (24.3)21 (56.8)15 (40.5)1 (2.7)312.5 ± 234.25159.7 ± 66.3.139.132.223.341Data are given as n (%) or mean ± standard deviation unless otherwise noted, n: number, min: minutes Significance at P<.05OHIP scoresTable 2 shows the mean OHIP score measured over all time points. Higher OHIP scores indicate lower OHRQoL. The range of T10 is 1-3 years. A correlation was found between the duration of surgery and the OHIP score on the first 7 days after surgery (r = 0.3 - 0.4, P < .05). The longer the surgery, the higher the OHIP score in the first week. No significant correlation was found between age, gender, blood loss, or OHIP score. The Friedman test was used to assess the mean OHIP scores over baseline (T0) and the first 7 days after surgery (T1-T7). The overall P-value < .00 indicates a significant overall difference in mean OHIP scores between the first 7 days. The mean OHIP score increased from T0 to T1 but tended to decrease from T1-T7. A post hoc pairwise comparison indicated that the OHIP score from T1-T6 was significantly higher than at T0, but there was no significant difference between T0 and T7 (Table 3).
