
Page 35 - Cellular Imaging in Regenerative Medicine, Cancer and Osteoarthritis
P. 35
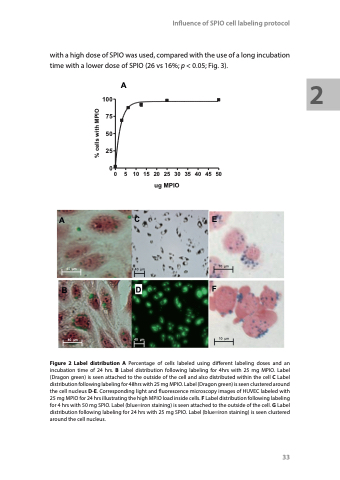
                                with a high dose of SPIO was used, compared with the use of a long incubation time with a lower dose of SPIO (26 vs 16%; p < 0.05; Fig. 3).
Influence of SPIO cell labeling protocol
 A
100 75 50 25
00 5 101520253035404550 ug MPIO
                               AC 40 μm 40 μm
BD
40 μm 40 μm
E
10 μm
F
10 μm
         Figure 2 Label distribution A Percentage of cells labeled using different labeling doses and an incubation time of 24 hrs. B Label distribution following labeling for 4hrs with 25 mg MPIO. Label (Dragon green) is seen attached to the outside of the cell and also distributed within the cell C Label distribution following labeling for 48hrs with 25 mg MPIO. Label (Dragon green) is seen clustered around the cell nucleus D-E. Corresponding light and fluorescence microscopy images of HUVEC labeled with 25 mg MPIO for 24 hrs illustrating the high MPIO load inside cells. F Label distribution following labeling for 4 hrs with 50 mg SPIO. Label (blue=iron staining) is seen attached to the outside of the cell. G Label distribution following labeling for 24 hrs with 25 mg SPIO. Label (blue=iron staining) is seen clustered around the cell nucleus.
33
2
 % cells with MPIO
