
Page 33 - Cellular Imaging in Regenerative Medicine, Cancer and Osteoarthritis
P. 33
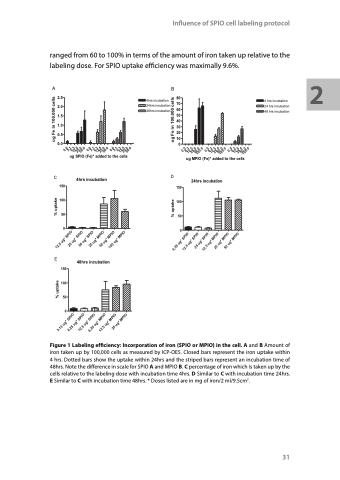
                                ranged from 60 to 100% in terms of the amount of iron taken up relative to the labeling dose. For SPIO uptake efficiency was maximally 9.6%.
Influence of SPIO cell labeling protocol
 AB
2.5 2.0 1.5 1.0 0.5 0.0
150 100 50 0
E
150 100 50 0
4hrs incubation 24hrs incubation 48hrs incubation
80 70 60 50 40 30 20 10
0
150 100 50 0
4 hrs incubation 24 hrs incubation 48 hrs incubation
                                    C
4hrs incubation
24hrs incubation
ug SPIO (Fe)* added to the cells
ug MPIO (Fe)* added to the cells
D
                                          48hrs incubation
                     Figure 1 Labeling efficiency: Incorporation of iron (SPIO or MPIO) in the cell. A and B Amount of iron taken up by 100,000 cells as measured by ICP-OES. Closed bars represent the iron uptake within 4 hrs. Dotted bars show the uptake within 24hrs and the striped bars represent an incubation time of 48hrs. Note the difference in scale for SPIO A and MPIO B. C percentage of iron which is taken up by the cells relative to the labeling dose with incubation time 4hrs. D Similar to C with incubation time 24hrs. E Similar to C with incubation time 48hrs. * Doses listed are in mg of iron/2 ml/9.5cm2.
31
2
 3.13 ug* SPIO 6.25 ug* SPIO
50.0 100.0
12.5 ug* SPIO 6.25 ug* MPIO
50.0 100.0
12.5 ug* MPIO
25 ug* MPIO
12.5 ug* SPIO
25 ug* SPIO
50 ug* SPIO
25 ug* MPIO
0.0 6.3
50 ug* MPIO
100 ug* MPIO
12.5 25.0
0.0 3.1
6.3 12.5
25.0 50.0
0.0 3.1
6.3 12.5
25.0 50.0
0.0 3.1
6.3 12.5
25.0 50.0
50.0 100.0
0.0 6.3
12.5 25.0
0.0 6.3
12.5 25.0
6.25 ug* SPIO 12.5 ug* SPIO
25 ug* SPIO 12.5 ug* MPIO
25 ug* MPIO
50 ug* MPIO
% uptake
% uptake
ug Fe in 100.000 cells
% uptake ug Fe in 100.000 cells
