
Page 36 - Cellular Imaging in Regenerative Medicine, Cancer and Osteoarthritis
P. 36
Chapter 2
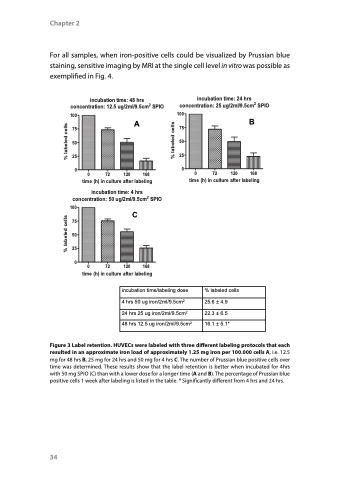
For all samples, when iron-positive cells could be visualized by Prussian blue staining, sensitive imaging by MRI at the single cell level in vitro was possible as exemplified in Fig. 4.
incubation time: 48 hrs concentration:12.5ug/2ml/9.5cm2SPIO
incubation time: 24 hrs 2 concentration:25ug/2ml/9.5cm SPIO
100 75 50 25 0
A
100 75 50 25 0
B
% labeled cells % labeled cells
% labeled cells
0 72 120 168 time (h) in culture after labeling
0 72 120 168 time (h) in culture after labeling
incubation time: 4 hrs concentration: 50 ug/2ml/9.5cm2 SPIO
100 75 50 25 0
C
0 72 120 168 time (h) in culture after labeling
incubation time/labeling dose 4 hrs 50 ug iron/2ml/9.5cm2
24 hrs 25 ug iron/2ml/9.5cm2 48 hrs 12.5 ug iron/2ml/9.5cm2
% labeled cells
25.6 ± 4.9 22.3 ± 6.5 16.1 ± 5.1*
Figure 3 Label retention. HUVECs were labeled with three different labeling protocols that each resulted in an approximate iron load of approximately 1.25 mg iron per 100.000 cells A, i.e. 12.5 mg for 48 hrs B, 25 mg for 24 hrs and 50 mg for 4 hrs C. The number of Prussian blue positive cells over time was determined. These results show that the label retention is better when incubated for 4hrs with 50 mg SPIO (C) than with a lower dose for a longer time (A and B). The percentage of Prussian blue positive cells 1 week after labeling is listed in the table. * Significantly different from 4 hrs and 24 hrs.
34
