
Page 144 - Crossing Cultural Boundaries - Cees den Teuling
P. 144
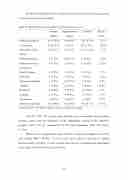
In Table 10 distribution of the respondents by the main area of operations (goods or services delivered) is presented.
Table 10: Distribution of respondents by main business sectors
     Industrial products Construction Agriculture-food, fishery
Mineral resources Business-services, consultancy Retail/Tourism Education Telecommunication Trading
Healthcare Logistics
Automotive
Alumni sample 24 (17.8%) 16 (11.9%) 17 (12.6%)
2 (1.5%) 9 (6.7%)
8 (5.9%) 5 (3.7%) 3 (2.2%) 7 (5.2%) 6 (4.4%) 2 (1.5%) 1 (0.7%) 35 (25.9%)
Organisations sample
0 (0.0%)
4 (12.5)
2 (6.3%)
9 (28.1%) 2 (6.3%)
1 (3.1%)
2 (6.3%) 4 (12.5%) 0 (0.0%) 0 (0.0%) 0 (0.0%) 0 (0.0%) 8 (25.0%)
Combined Russia 2015*
24 (14.3 %) 8.2% 20 (11.9%) 10.2% 19 (11.3%) 3.1%
11 (6.6%) 0.4% 11 (6.6%) 21.5%
9 (5.3%) 9.7% 7 (4.3%) 2.9% 7 (4.3%) 0.5% 7 (4.3%) 16.8% 6 (3.6%) 1.7% 2 (1.3%) 6.1% 1 (0.6%) 0.2% 43 (25.7%) 18.7%
     Others/not specified
*Goskomstat 2015. The shares by business sectors in the Russian economy.
 From the Table 10 it can be seen that there were respondents from all main business sectors with the dominance of the respondents working in the industrial products sector (14.3%), construction (11.9%) and Agriculture, food and fishery (11.3%).
Majority of the organisations, representatives of which participated in the survey were smaller SME’s (84.4%). 53.1% of them had a turnover less than 25 million Russian roubles. In Tables 11 and 12 details about the size of organisations participated in the survey and their turnover are presented.
142
