
Page 82 - Demo
P. 82
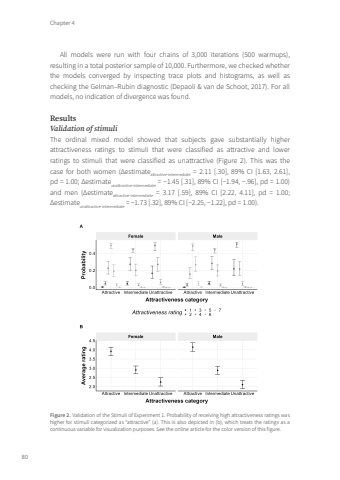
Chapter 480All models were run with four chains of 3,000 iterations (500 warmups), resulting in a total posterior sample of 10,000. Furthermore, we checked whether the models converged by inspecting trace plots and histograms, as well as checking the Gelman–Rubin diagnostic (Depaoli & van de Schoot, 2017). For all models, no indication of divergence was found.ResultsValidation of stimuliThe ordinal mixed model showed that subjects gave substantially higher attractiveness ratings to stimuli that were classified as attractive and lower ratings to stimuli that were classified as unattractive (Figure 2). This was the case for both women (Δestimateattractive-intermediate = 2.11 [.30], 89% CI [1.63, 2.61], pd = 1.00; Δestimateunattractive-intermediate = −1.45 [.31], 89% CI [−1.94, −.96], pd = 1.00) and men (Δestimateattractive-intermediate = 3.17 [.59], 89% CI [2.22, 4.11], pd = 1.00; Δestimateunattractive-intermediate = −1.73 [.32], 89% CI [−2.25, −1.22], pd = 1.00).Figure 2. Validation of the Stimuli of Experiment 1. Probability of receiving high attractiveness ratings was higher for stimuli categorized as “attractive” (a). This is also depicted in (b), which treats the ratings as a continuous variable for visualization purposes. See the online article for the color version of this figure.Tom Roth.indd 80 08-01-2024 10:41
