
Page 80 - Demo
P. 80
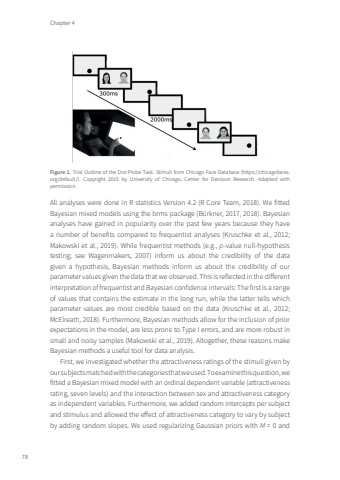
Chapter 478Figure 1. Trial Outline of the Dot-Probe Task. Stimuli from Chicago Face Database (https://chicagofaces.org/default/). Copyright 2015 by University of Chicago, Center for Decision Research. Adapted with permission.All analyses were done in R statistics Version 4.2 (R Core Team, 2018). We fitted Bayesian mixed models using the brms package (Bürkner, 2017, 2018). Bayesian analyses have gained in popularity over the past few years because they have a number of benefits compared to frequentist analyses (Kruschke et al., 2012; Makowski et al., 2019). While frequentist methods (e.g., p-value null-hypothesis testing; see Wagenmakers, 2007) inform us about the credibility of the data given a hypothesis, Bayesian methods inform us about the credibility of our parameter values given the data that we observed. This is reflected in the different interpretation of frequentist and Bayesian confidence intervals: The first is a range of values that contains the estimate in the long run, while the latter tells which parameter values are most credible based on the data (Kruschke et al., 2012; McElreath, 2018). Furthermore, Bayesian methods allow for the inclusion of prior expectations in the model, are less prone to Type I errors, and are more robust in small and noisy samples (Makowski et al., 2019). Altogether, these reasons make Bayesian methods a useful tool for data analysis.First, we investigated whether the attractiveness ratings of the stimuli given by our subjects matched with the categories that we used. To examine this question, we fitted a Bayesian mixed model with an ordinal dependent variable (attractiveness rating, seven levels) and the interaction between sex and attractiveness category as independent variables. Furthermore, we added random intercepts per subject and stimulus and allowed the effect of attractiveness category to vary by subject by adding random slopes. We used regularizing Gaussian priors with M = 0 and Tom Roth.indd 78 08-01-2024 10:41
