
Page 247 - Demo
P. 247
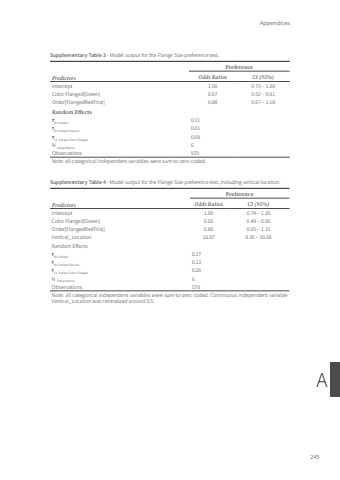
Appendices245ASupplementary Table 3 - Model output for the Flange Size preference test.PredictorsPreferenceOdds Ratios CI (95%)Intercept 1.00 0.73 – 1.38Color Flanged[Green] 0.67 0.52 – 0.91Order[FlangedRedFirst] 0.88 0.67 – 1.18Random Effectsτ00 Subject 0.11τ00 Subject:Session 0.01τ11 Subject:Color Flanged 0.09N SubjectName 6Observations 570Note: all categorical independent variables were sum-to-zero coded.Supplementary Table 4 - Model output for the Flange Size preference test, including vertical location.PredictorsPreferenceOdds Ratios CI (95%)Intercept 1.00 0.74 – 1.35Color Flanged[Green] 0.65 0.49 – 0.90Order[FlangedRedFirst] 0.86 0.65 – 1.15Vertical_Location 16.97 9.35 – 30.66Random Effectsτ00 Subject 0.27τ00 Subject:Session 0.13τ11 Subject:Color Flanged 0.26N SubjectName 6Observations 570Note: all categorical independent variables were sum-to-zero coded. Continuous independent variable Vertical_Location was centralized around 0.5.Tom Roth.indd 245 08-01-2024 10:42
