
Page 118 - Demo
P. 118
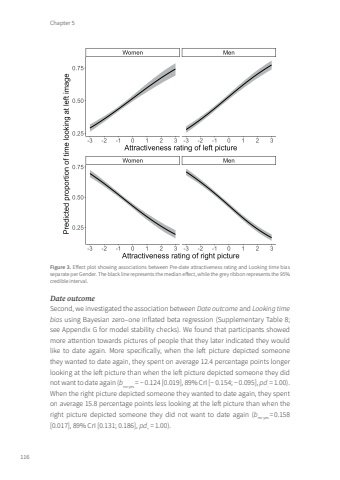
Chapter 5116Figure 3. Effect plot showing associations between Pre-date attractiveness rating and Looking time bias separate per Gender. The black line represents the median effect, while the grey ribbon represents the 95% credible interval.Date outcomeSecond, we investigated the association between Date outcome and Looking time bias using Bayesian zero–one inflated beta regression (Supplementary Table 8; see Appendix G for model stability checks). We found that participants showed more attention towards pictures of people that they later indicated they would like to date again. More specifically, when the left picture depicted someone they wanted to date again, they spent on average 12.4 percentage points longer looking at the left picture than when the left picture depicted someone they did not want to date again (bno-yes = − 0.124 [0.019], 89% CrI [− 0.154; − 0.095], pd-= 1.00). When the right picture depicted someone they wanted to date again, they spent on average 15.8 percentage points less looking at the left picture than when the right picture depicted someone they did not want to date again (bno-yes = 0.158 [0.017], 89% CrI [0.131; 0.186], pd+ = 1.00).Tom Roth.indd 116 08-01-2024 10:41
