
Page 117 - Demo
P. 117
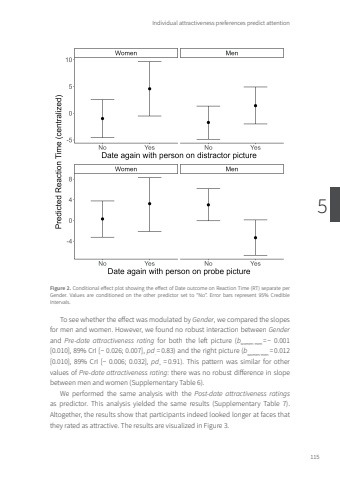
Individual attractiveness preferences predict attention1155Figure 2. Conditional effect plot showing the effect of Date outcome on Reaction Time (RT) separate per Gender. Values are conditioned on the other predictor set to “No”. Error bars represent 95% Credible Intervals.To see whether the effect was modulated by Gender, we compared the slopes for men and women. However, we found no robust interaction between Genderand Pre-date attractiveness rating for both the left picture (bwomen-men = − 0.001 [0.010], 89% CrI [− 0.026; 0.007], pd-= 0.83) and the right picture (bwomen-men = 0.012 [0.010], 89% CrI [− 0.006; 0.032], pd+ = 0.91). This pattern was similar for other values of Pre-date attractiveness rating: there was no robust difference in slope between men and women (Supplementary Table 6).We performed the same analysis with the Post-date attractiveness ratingsas predictor. This analysis yielded the same results (Supplementary Table 7). Altogether, the results show that participants indeed looked longer at faces that they rated as attractive. The results are visualized in Figure 3.Tom Roth.indd 115 08-01-2024 10:41
