
Page 174 - Assessing right ventricular function and the pulmonary circulation in pulmonary hypertension Onno Anthonius Spruijt
P. 174
10
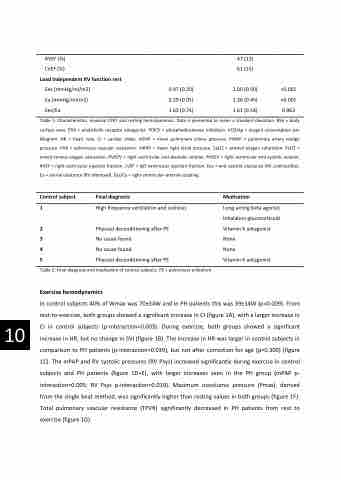
RVEF (%)
LVEF (%)
Load independent RV function rest
Ees (mmHg/ml/m2) Ea (mmHg/ml/m2) Ees/Ea
- 47 (13) - 61 (15)
0.47 (0.20) 2.00 (0.50) 0.29 (0.05) 1.36 (0.45) 1.63 (0.74) 1.61 (0.54)
<0.001 <0.001 0.963
Table 1: Characteristics, maximal CPET and resting hemodynamics. Data is presented as mean ± standard deviation. BSA = body surface area. ERA = endothelin receptor antagonist. PDE5I = phosphodiesterase inhibitors. VO2/kg = oxygen consumption per kilogram. HR = heart rate. CI = cardiac index. mPAP = mean pulmonary artery pressure. PAWP = pulmonary artery wedge pressure. PVR = pulmonary vascular resistance. mRAP = mean right atrial pressure. SaO2 = arterial oxygen saturation. SvO2 = mixed venous oxygen saturation. RVEDV = right ventricular end-diastolic volume. RVESV = right ventricular end-systolic volume. RVEF = right ventricular ejection fraction. LVEF = left ventricular ejection fraction. Ees = end-systolic elastance (RV contractility). Ea = aterial elastance (RV afterload). Ees/Ea = right ventricular-arterial coupling.
Control subject 1
Final diagnosis
High frequency ventilation and scoliosis
Medication
Long-acting beta agonist; Inhalation glucocorticoid Vitamin K antagonist None
None
Vitamin K antagonist
2
3
4
5
Table 2: Final diagnosis and medication of control subjects. PE = pulmonary embolism.
Physical deconditioning after PE No cause found
No cause found
Physical deconditioning after PE
Exercise hemodynamics
In control subjects 40% of Wmax was 70±34W and in PH patients this was 39±14W (p=0.009). From rest-to-exercise, both groups showed a significant increase in CI (figure 1A), with a larger increase in CI in control subjects (p-interaction=0.003). During exercise, both groups showed a significant increase in HR, but no change in SVI (figure 1B). The increase in HR was larger in control subjects in comparison to PH patients (p-interaction=0.039), but not after correction for age (p=0.300) (figure 1C). The mPAP and RV systolic pressures (RV Psys) increased significantly during exercise in control subjects and PH patients (figure 1D+E), with larger increases seen in the PH group (mPAP p- interaction=0.005; RV Psys p-interaction=0.019). Maximum isovolumic pressure (Pmax), derived from the single beat method, was significantly higher than resting values in both groups (figure 1F). Total pulmonary vascular resistance (TPVR) significantly decreased in PH patients from rest to exercise (figure 1G).
