
Page 41 - Risk quantification and modification in older patients with colorectal cancer
P. 41
Risk prediction models for CRC patients
39
2
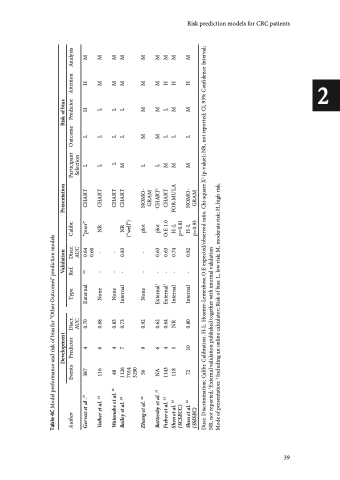
Table 4C Model performance and risk of bias for “Other Outcomes” prediction models
Author Events
Predictor Discr. AUC
Type External 60
Discr. Calibr. AUC
Participant Outcome Predictor Selection
Attrition Analysis
Gervaz et al .17 387
4 0.70 6 0.68
“poor”
- - NR CHART
LLH
H M
Vather et al. 24 116
None
L L L
M M
Watanabe et al. 25 48
4 0.83 7 0.73
None Internal
- - CHART
LLL MLL
M M M M
Bailey et al. 28 1126 7014 3290
- 0.83 NR CHART (“well”)
Zhang et al. 30 56
9 0.92
None
- - plot NOMO- GRAM
L M M
M M
Battersby et al. 31 Fieber et al. 32
NA 6 0.62 1143 4 0.64 118 5 NR
External1 External1 Internal
- 0.63 - 0.63 - 0.74
plot CHART2 L M M
M M H M H M
Shen et al. 34 (SCSECC)
H-L FOR-MULA M L M p=0.81
Shen et al. 34 (SSISEC)
72 10 0.80
Internal
- 0.82
H-LNOMO-MLM p=0.93 GRAM
H M
Development
Validation
Presentation
Risk of bias
Ref.
0.64 0.60
CHART
Discr. Discrimination; Calibr. Calibration. H-L: Hosmer-Lemeshow, O:E expected/observed ratio. Chi-square X2 (p-value); NR, not reported; CI, 95% Confidence Interval; NR, not reported; 1External validation published together with internal validation
Mode of presentation: 2 Including an online calculator; Risk of bias: L, low risk; M, moderate risk; H, high risk.
O:E 1.0 CHART M L L
