
Page 39 - Risk quantification and modification in older patients with colorectal cancer
P. 39
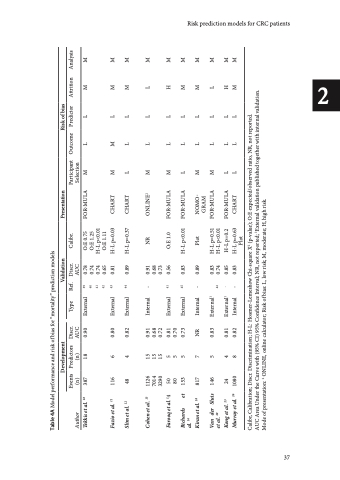
                                Risk prediction models for CRC patients
                       37
2
 Table 4A Model performance and risk of bias for “mortality” prediction models
Events Author (n)
Analysis
Tekkis et al. 10 387 Fazio et al. 11 116
18 0.90
External 39 40
0.78 O:E 0.75 0.74 O:E 1.25 0.74 H-L p<0.01 0.65 O:E 1.11
FOR-MULA
M L L
Slim et al. 12 48
6 0.80 4 0.82
External 43 External 44
0.81 H-L p=0.03 0.89 H-L p=0.37
CHART CHART
M M L L L L
M M M M
Cohen et al. 13 1126 7014 3290
15 0.91 15 0.68 15 0.72
Internal -
0.91 NR 0.68
0.73
ONLINE2
M L L
L M
Farooq et al. 14 50 80
5 0.81 5 0.70
External 41 External 45 Internal -
0.56 O:E 1.0 0.83 H-L p<0.01 0.89 Plot 0.83 H-L p=0.51
FOR-MULA FOR-MULA
M L L
H M
Richards et 153 al. 16
L L L
M M
Kiran et al. 18
5 0.73 817 7 NR 146 5 0.83
NOMO- GRAM
M L L
M M
Van der Sluis et al. 20
External1
42 0.74 H-L p<0.01
FOR-MULA
M L L
L M
Kong et al. 23 Murray et al. 26
24 4 0.81 1080 8 0.82
External1 - Internal -
0.85 H-L p=0.2
FOR-MULA CHART
L L L L L L
H M M M
Development
Validation
Presentation
Risk of bias
Predictors Discr. (n) AUC
Type Ref.
Discr. Calibr. AUC
Participant Outcome Predictor Selection
Attrition
M M
41 42
0.83 H-L p=0.63 Plot
Calibr, Calibration; Discr. Discrimination; H-L: Hosmer-Lemeshow Chi-square X2 (p-value); O:E expected/observed ratio, NR, not reported. AUC Area Under the Curve with (95% CI) 95% Confidence Interval; NR, not reported; 1External validation published together with internal Mode of presentation: 2 ONLINE, online calculator; Risk of bias: L, low risk; M, moderate; H, high risk.
validation.
