
Page 60 - scheppingen
P. 60
three
58
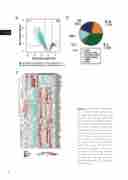
Figure 2 Small RNA landscape of TSC cortical tubers determined by using small RNA-seq data. (a) Volcano plot showing differential expression of small RNAs between TSC tubers and post-mortem con- trol cortex. A total of 932 small RNAs were found to be under-ex- pressed and 59 over-expressed in TSC tubers compared to con- trol cortex tissue (b) Distribution of various classes of small RNAs among the over- and under-ex- pressed transcripts in TSC corti- cal tubers (c) Heat map showing the expression of the 48 over-ex- pressed and top 10 under-ex- pressed miRNAs in TSC tubers and control cortex.
